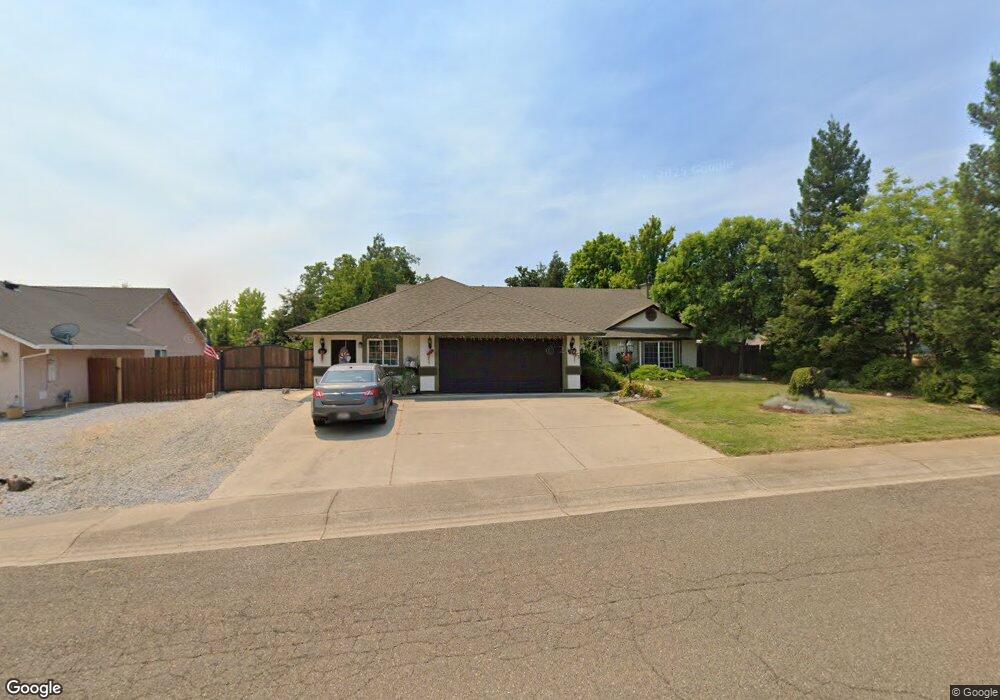
19483 Posey Ln Unit 1 Redding, CA 96003
Hawley NeighborhoodEstimated Value: $470,000 - $510,000
4
Beds
2
Baths
1,971
Sq Ft
$249/Sq Ft
Est. Value
About This Home
This home is located at 19483 Posey Ln Unit 1, Redding, CA 96003 and is currently estimated at $491,116, approximately $249 per square foot. 19483 Posey Ln Unit 1 is a home located in Shasta County with nearby schools including Shasta View Academy, Bethel Christian School, and Country Christian School.
Ownership History
Date
Name
Owned For
Owner Type
Purchase Details
Closed on
Jan 8, 2018
Sold by
Bushnell Sharon
Bought by
Bushnell Sharon L and The Sharo L Bushnell 2018 Trus
Current Estimated Value
Purchase Details
Closed on
Oct 17, 2000
Sold by
Inc Lynn David Construction & Developme
Bought by
Bushnell Michael and Bushnell Sharon
Home Financials for this Owner
Home Financials are based on the most recent Mortgage that was taken out on this home.
Original Mortgage
$135,000
Outstanding Balance
$49,127
Interest Rate
7.89%
Estimated Equity
$441,989
Purchase Details
Closed on
Sep 13, 2000
Sold by
Jenkins Robert D
Bought by
Jenkins Mary B and The Jenkins Family Trust
Home Financials for this Owner
Home Financials are based on the most recent Mortgage that was taken out on this home.
Original Mortgage
$135,000
Outstanding Balance
$49,127
Interest Rate
7.89%
Estimated Equity
$441,989
Create a Home Valuation Report for This Property
The Home Valuation Report is an in-depth analysis detailing your home's value as well as a comparison with similar homes in the area
Home Values in the Area
Average Home Value in this Area
Purchase History
| Date | Buyer | Sale Price | Title Company |
|---|---|---|---|
| Bushnell Sharon L | -- | None Available | |
| Bushnell Sharon | -- | None Available | |
| Bushnell Michael | $188,500 | Chicago Title Co | |
| Jenkins Mary B | -- | -- |
Source: Public Records
Mortgage History
| Date | Status | Borrower | Loan Amount |
|---|---|---|---|
| Open | Bushnell Michael | $135,000 |
Source: Public Records
Tax History
| Year | Tax Paid | Tax Assessment Tax Assessment Total Assessment is a certain percentage of the fair market value that is determined by local assessors to be the total taxable value of land and additions on the property. | Land | Improvement |
|---|---|---|---|---|
| 2025 | $3,353 | $302,773 | $53,479 | $249,294 |
| 2024 | $3,288 | $296,837 | $52,431 | $244,406 |
| 2023 | $3,288 | $291,017 | $51,403 | $239,614 |
| 2022 | $3,190 | $285,312 | $50,396 | $234,916 |
| 2021 | $3,174 | $279,718 | $49,408 | $230,310 |
| 2020 | $3,140 | $276,851 | $48,902 | $227,949 |
| 2019 | $3,043 | $271,424 | $47,944 | $223,480 |
| 2018 | $3,063 | $266,103 | $47,004 | $219,099 |
| 2017 | $3,012 | $260,886 | $46,083 | $214,803 |
| 2016 | $2,883 | $255,772 | $45,180 | $210,592 |
| 2015 | $2,838 | $251,931 | $44,502 | $207,429 |
| 2014 | $2,848 | $246,997 | $43,631 | $203,366 |
Source: Public Records
Map
Nearby Homes
- 19424 Posey Ln
- 1102 Hope Ln
- 19219 Nike Ct
- 61 Tidmore Ln
- 19340 Carnegie Ct
- 11632 Ridgewood Rd
- 2192 Princeton Way
- 2199 Princeton Way
- 332 Franciscan Trail
- 948 & 950 Hawley
- 2182 Cadjew St
- 1546 Gold Hills Dr
- 547 Casa Buena St
- 550 Armando Ave
- 2110 Cadjew St
- 2134 Cadjew St
- 5961 Sierra Dr
- 5976 Sierra Dr
- 662 Ansley Ct
- 2132 Hope Ln
- 19489 Posey Ln
- 19477 Posey Ln
- 19471 Posey Ln
- 838 Cally Ct
- 838 Cally Ct Unit 1
- 866 Cally Ct
- 0 Posey Model 1948
- 0 Posey Model 1410
- 0 Posey Model 1828
- 832 Cally Ct
- 832 Cally Ct Unit 2
- 881 Cally Ct Unit A & B
- 881 Cally Ct
- 881 Cally Ct Unit 1
- 908 Twin Tower Dr
- 19465 Posey Ln
- 875 Cally Ct
- 869 Cally Ct
- 869 Cally Ct Unit 1
- 820 Cally Ct
Your Personal Tour Guide
Ask me questions while you tour the home.