1949 390th Ave Shenandoah, IA 51601
Estimated Value: $341,000 - $766,947
3
Beds
3
Baths
2,642
Sq Ft
$219/Sq Ft
Est. Value
About This Home
This home is located at 1949 390th Ave, Shenandoah, IA 51601 and is currently estimated at $577,487, approximately $218 per square foot. 1949 390th Ave is a home located in Fremont County with nearby schools including Shenandoah Elementary School, Shenandoah Middle School, and Shenandoah High School.
Ownership History
Date
Name
Owned For
Owner Type
Purchase Details
Closed on
Nov 15, 2023
Sold by
Isaacson Todd M and Isaacson Jill
Bought by
Jensen Jay Burton and Jensen Mary Allison
Current Estimated Value
Purchase Details
Closed on
Jun 2, 2010
Sold by
Anderzhon Kristofer B and Racine Denise L
Bought by
Isaacson Todd M
Home Financials for this Owner
Home Financials are based on the most recent Mortgage that was taken out on this home.
Original Mortgage
$162,011
Interest Rate
4.83%
Mortgage Type
FHA
Create a Home Valuation Report for This Property
The Home Valuation Report is an in-depth analysis detailing your home's value as well as a comparison with similar homes in the area
Home Values in the Area
Average Home Value in this Area
Purchase History
| Date | Buyer | Sale Price | Title Company |
|---|---|---|---|
| Jensen Jay Burton | $5,000 | None Listed On Document | |
| Isaacson Todd M | $165,000 | -- |
Source: Public Records
Mortgage History
| Date | Status | Borrower | Loan Amount |
|---|---|---|---|
| Previous Owner | Isaacson Todd M | $162,011 |
Source: Public Records
Tax History Compared to Growth
Tax History
| Year | Tax Paid | Tax Assessment Tax Assessment Total Assessment is a certain percentage of the fair market value that is determined by local assessors to be the total taxable value of land and additions on the property. | Land | Improvement |
|---|---|---|---|---|
| 2025 | $3,252 | $282,280 | $69,380 | $212,900 |
| 2024 | $3,252 | $251,260 | $69,380 | $181,880 |
| 2023 | $3,052 | $255,880 | $74,000 | $181,880 |
| 2022 | $2,918 | $218,490 | $44,630 | $173,860 |
| 2021 | $2,918 | $199,220 | $41,630 | $157,590 |
| 2020 | $2,724 | $190,940 | $41,630 | $149,310 |
| 2019 | $2,916 | $185,300 | $0 | $0 |
| 2018 | $2,838 | $185,300 | $0 | $0 |
| 2017 | $2,594 | $166,930 | $0 | $0 |
| 2016 | $2,528 | $166,930 | $0 | $0 |
| 2015 | $2,528 | $166,930 | $0 | $0 |
| 2014 | $2,560 | $166,930 | $0 | $0 |
Source: Public Records
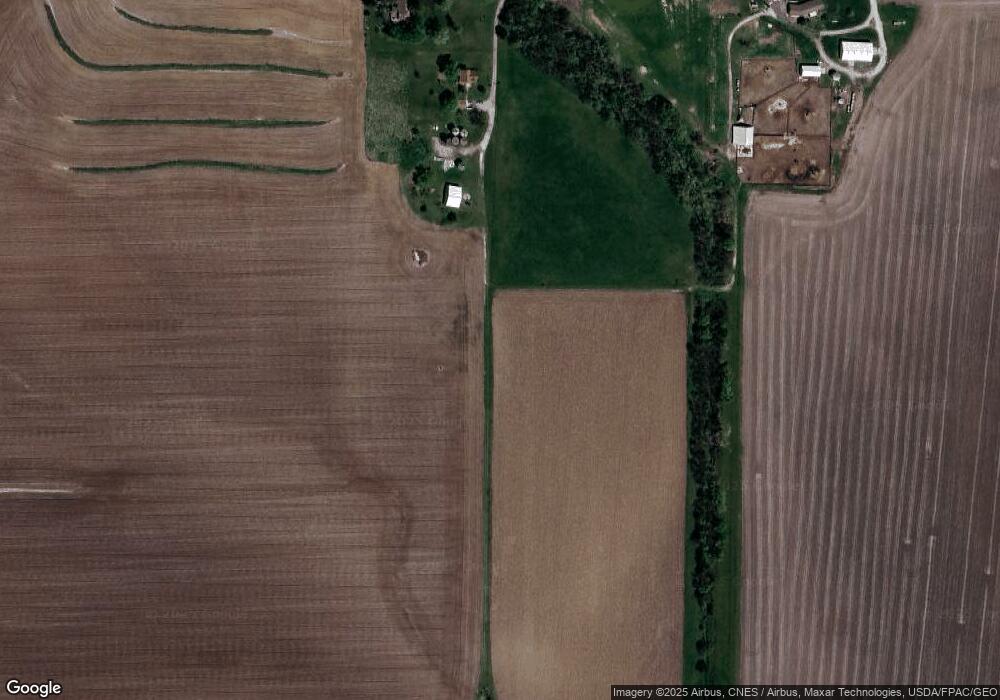
Map
Nearby Homes