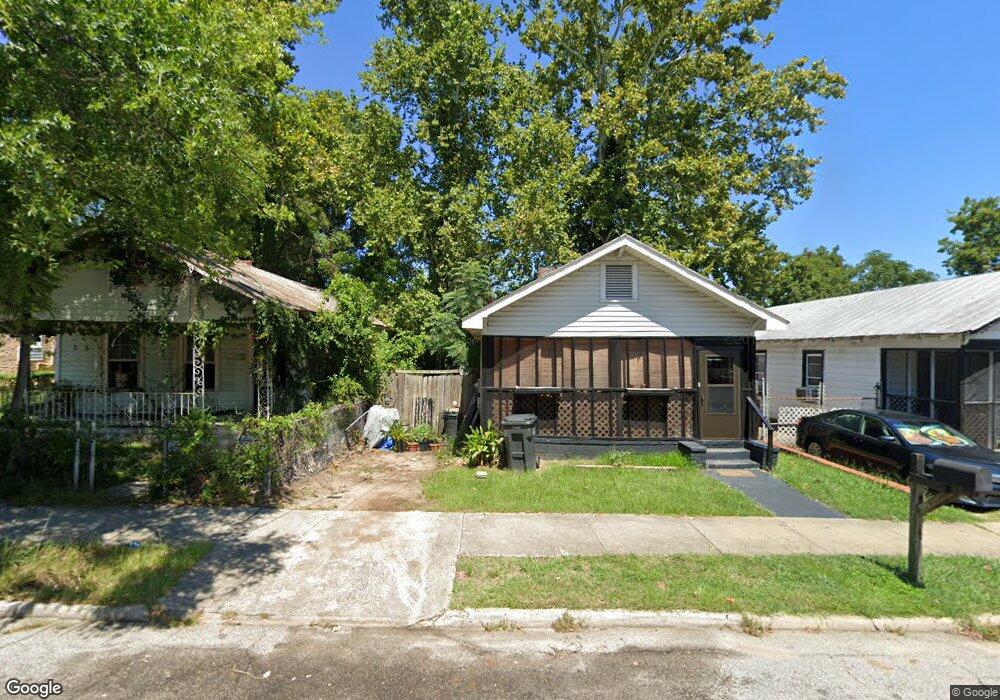
1949 Ellis St Augusta, GA 30904
West End NeighborhoodEstimated Value: $56,000 - $115,000
2
Beds
1
Bath
1,060
Sq Ft
$75/Sq Ft
Est. Value
About This Home
This home is located at 1949 Ellis St, Augusta, GA 30904 and is currently estimated at $79,190, approximately $74 per square foot. 1949 Ellis St is a home located in Richmond County with nearby schools including Lamar Elementary School, W.S. Hornsby K-8 School, and Johnson Magnet.
Ownership History
Date
Name
Owned For
Owner Type
Purchase Details
Closed on
Mar 19, 2024
Sold by
Plemmons Properties Llc
Bought by
A & C Investments Inc
Current Estimated Value
Purchase Details
Closed on
Dec 23, 2022
Sold by
Plemmons Michael Earl
Bought by
Plemmons Properties Llc
Purchase Details
Closed on
Mar 5, 2010
Sold by
Miller Steve
Bought by
Plemmons Michael E
Purchase Details
Closed on
Feb 1, 2007
Sold by
Brown Franklin
Bought by
Miller Steve
Purchase Details
Closed on
Mar 30, 2004
Sold by
Quarles Phillip D
Bought by
Brown Franklin
Home Financials for this Owner
Home Financials are based on the most recent Mortgage that was taken out on this home.
Original Mortgage
$19,160
Interest Rate
5.53%
Mortgage Type
Purchase Money Mortgage
Purchase Details
Closed on
Jan 25, 2001
Sold by
Kelly John L
Bought by
Quarles Phillip D
Home Financials for this Owner
Home Financials are based on the most recent Mortgage that was taken out on this home.
Original Mortgage
$16,166
Interest Rate
7.44%
Create a Home Valuation Report for This Property
The Home Valuation Report is an in-depth analysis detailing your home's value as well as a comparison with similar homes in the area
Home Values in the Area
Average Home Value in this Area
Purchase History
| Date | Buyer | Sale Price | Title Company |
|---|---|---|---|
| A & C Investments Inc | $23,000 | -- | |
| Plemmons Properties Llc | -- | -- | |
| Plemmons Michael E | $2,000 | -- | |
| Miller Steve | $18,000 | None Available | |
| Brown Franklin | $23,000 | -- | |
| Quarles Phillip D | $13,000 | -- | |
| Kelly John L | $13,000 | -- |
Source: Public Records
Mortgage History
| Date | Status | Borrower | Loan Amount |
|---|---|---|---|
| Previous Owner | Brown Franklin | $19,160 | |
| Previous Owner | Kelly John L | $16,166 |
Source: Public Records
Tax History Compared to Growth
Tax History
| Year | Tax Paid | Tax Assessment Tax Assessment Total Assessment is a certain percentage of the fair market value that is determined by local assessors to be the total taxable value of land and additions on the property. | Land | Improvement |
|---|---|---|---|---|
| 2024 | $865 | $18,888 | $1,780 | $17,108 |
| 2023 | $865 | $23,908 | $1,780 | $22,128 |
| 2022 | $972 | $21,631 | $1,780 | $19,851 |
| 2021 | $777 | $13,896 | $1,778 | $12,118 |
| 2020 | $843 | $16,118 | $4,000 | $12,118 |
| 2019 | $778 | $13,213 | $1,259 | $11,954 |
| 2018 | $783 | $13,213 | $1,259 | $11,954 |
| 2017 | $780 | $13,213 | $1,259 | $11,954 |
| 2016 | $780 | $13,214 | $1,259 | $11,954 |
| 2015 | $784 | $13,214 | $1,259 | $11,954 |
| 2014 | $784 | $13,214 | $1,259 | $11,954 |
Source: Public Records
Map
Nearby Homes
- 1913 Ellis St
- 1918 Division St Unit 3
- 2021 Ellis St
- 2025 Ellis St
- 1916 Battle Row
- 2006 Division St
- 1940 Telfair St
- 608 Eve St
- 1918 Walker St
- 1916 Walker St
- 1827 Hicks St
- 1968 Battle Row
- 2048 Edgar St
- 605 Eve St
- 1858 Walker St
- 2063 Broad St
- 1929 Watkins St
- 1915 Watkins St
- 2056 Telfair St
- 1851 Wilhelm Ln