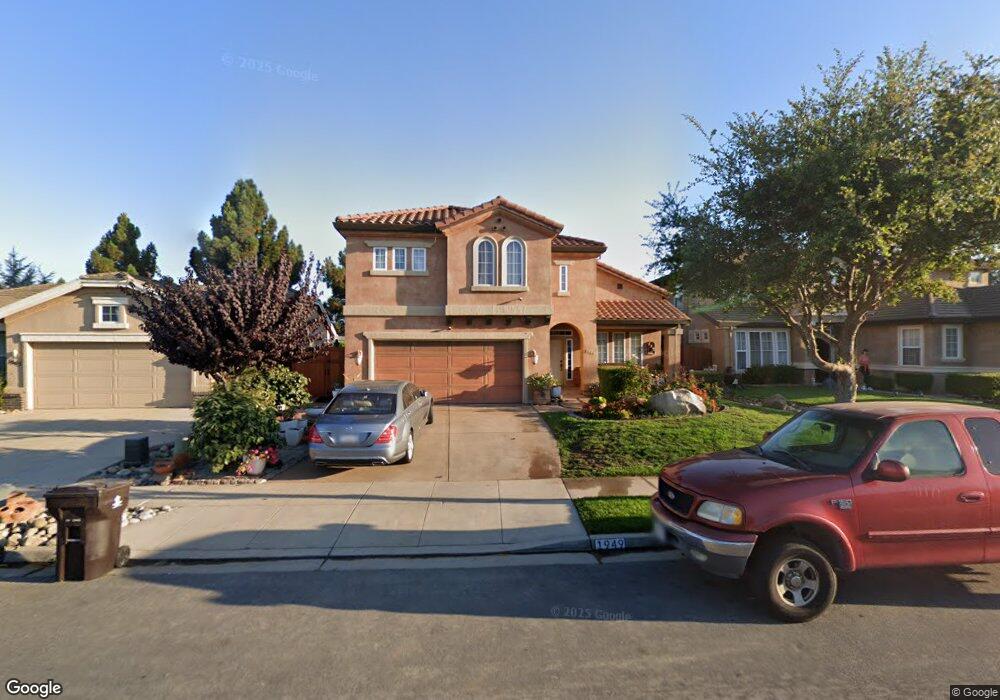
1949 Gladstone Way Salinas, CA 93906
Harden Ranch NeighborhoodEstimated Value: $885,553 - $936,000
4
Beds
3
Baths
2,195
Sq Ft
$415/Sq Ft
Est. Value
About This Home
This home is located at 1949 Gladstone Way, Salinas, CA 93906 and is currently estimated at $911,888, approximately $415 per square foot. 1949 Gladstone Way is a home located in Monterey County with nearby schools including North Salinas High School.
Ownership History
Date
Name
Owned For
Owner Type
Purchase Details
Closed on
Aug 28, 2001
Sold by
Melena Leonardo Alcala
Bought by
Melena Hermelinda P
Current Estimated Value
Home Financials for this Owner
Home Financials are based on the most recent Mortgage that was taken out on this home.
Original Mortgage
$71,000
Outstanding Balance
$30,211
Interest Rate
8.25%
Estimated Equity
$881,677
Purchase Details
Closed on
Aug 27, 2001
Sold by
Brimelow Alan A and Brimelow Barbara C
Bought by
Melena Hermilinda P
Home Financials for this Owner
Home Financials are based on the most recent Mortgage that was taken out on this home.
Original Mortgage
$71,000
Outstanding Balance
$30,211
Interest Rate
8.25%
Estimated Equity
$881,677
Purchase Details
Closed on
Jan 3, 2000
Sold by
Harrod Brothers
Bought by
Brimelow Alan A and Brimelow Barbara C
Home Financials for this Owner
Home Financials are based on the most recent Mortgage that was taken out on this home.
Original Mortgage
$218,260
Interest Rate
7.75%
Create a Home Valuation Report for This Property
The Home Valuation Report is an in-depth analysis detailing your home's value as well as a comparison with similar homes in the area
Home Values in the Area
Average Home Value in this Area
Purchase History
| Date | Buyer | Sale Price | Title Company |
|---|---|---|---|
| Melena Hermelinda P | -- | First American Title | |
| Melena Hermilinda P | $362,000 | First American Title | |
| Brimelow Alan A | $273,000 | Chicago Title Co |
Source: Public Records
Mortgage History
| Date | Status | Borrower | Loan Amount |
|---|---|---|---|
| Open | Melena Hermilinda P | $71,000 | |
| Previous Owner | Brimelow Alan A | $218,260 |
Source: Public Records
Tax History
| Year | Tax Paid | Tax Assessment Tax Assessment Total Assessment is a certain percentage of the fair market value that is determined by local assessors to be the total taxable value of land and additions on the property. | Land | Improvement |
|---|---|---|---|---|
| 2025 | $6,359 | $534,783 | $214,208 | $320,575 |
| 2024 | $6,359 | $524,298 | $210,008 | $314,290 |
| 2023 | $5,864 | $514,019 | $205,891 | $308,128 |
| 2022 | $5,808 | $503,941 | $201,854 | $302,087 |
| 2021 | $6,133 | $494,061 | $197,897 | $296,164 |
| 2020 | $5,458 | $488,996 | $195,868 | $293,128 |
| 2019 | $5,298 | $479,409 | $192,028 | $287,381 |
| 2018 | $5,457 | $470,010 | $188,263 | $281,747 |
| 2017 | $5,514 | $460,795 | $184,572 | $276,223 |
| 2016 | $5,351 | $451,760 | $180,953 | $270,807 |
| 2015 | $5,132 | $430,000 | $172,000 | $258,000 |
| 2014 | $4,773 | $409,000 | $164,000 | $245,000 |
Source: Public Records
Map
Nearby Homes
- 327 Rhine Ct
- 1838 Lancashire Dr
- 1667 Klamath Dr
- 1823 Broadway Dr
- 1780 Truckee Way
- 233 Montclair Ln
- 607 Calaveras Dr
- 634 Yreka Dr
- 383 Natividad Rd
- 1829 Delancey Dr
- 18594 Northridge Dr
- 1445 Amador Cir
- 1527 Atherton Way
- 1421 Amador Cir
- 55 San Juan Grade Rd Unit 79
- 55 San Juan Grade Rd Unit 18
- 55 San Juan Grade Rd Unit 63
- 1671 Cambrian Dr
- 336 Rainier Dr
- 323 Chaparral St
- 1953 Gladstone Way
- 1945 Gladstone Way
- 1957 Gladstone Way
- 1941 Gladstone Way
- 1948 Gladstone Way
- 1952 Gladstone Way
- 1961 Gladstone Way
- 1944 Gladstone Way
- 1937 Gladstone Way
- 1956 Gladstone Way
- 1940 Gladstone Way
- 1965 Gladstone Way
- 1960 Gladstone Way
- 10 Cromwell Cir
- 1933 Gladstone Way
- 15 Cromwell Cir
- 1918 Gladstone Way
- 6 Cromwell Cir
- 1929 Gladstone Way
- 1964 Gladstone Way
Your Personal Tour Guide
Ask me questions while you tour the home.