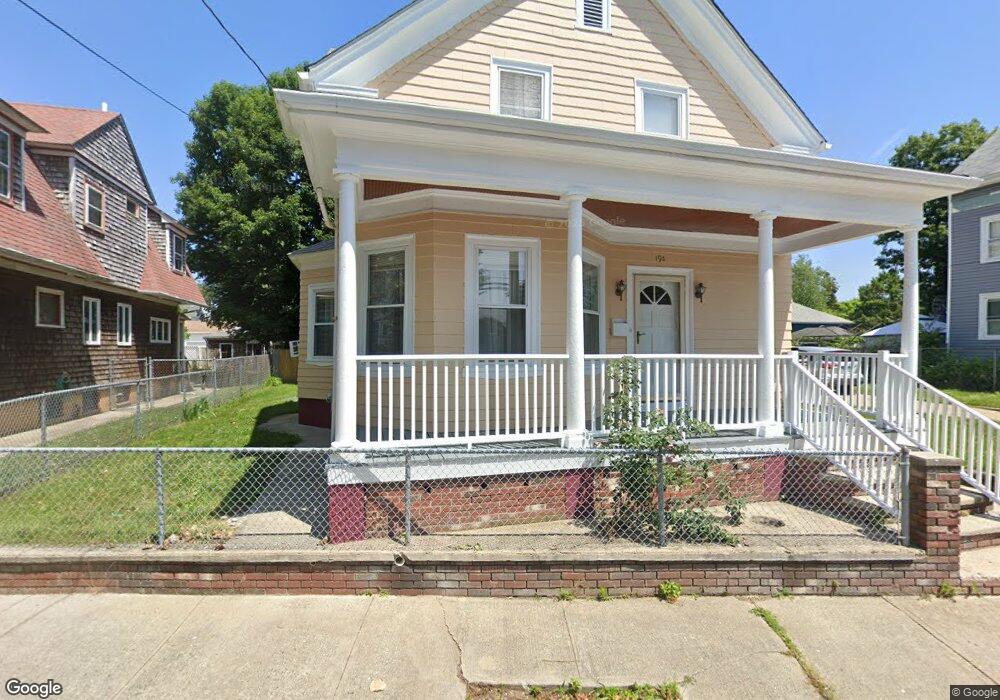
195 Baker St Providence, RI 02905
Washington Park NeighborhoodEstimated Value: $418,000 - $441,000
4
Beds
2
Baths
1,631
Sq Ft
$263/Sq Ft
Est. Value
About This Home
This home is located at 195 Baker St, Providence, RI 02905 and is currently estimated at $428,314, approximately $262 per square foot. 195 Baker St is a home located in Providence County with nearby schools including Asa Messer Elementary School, Charles N. Fortes Elementary School, and Alan Shawn Feinstein Elementary.
Ownership History
Date
Name
Owned For
Owner Type
Purchase Details
Closed on
Dec 8, 2023
Sold by
Varela Tomas C and Varela Matilde A
Bought by
Tomas C Varela T C and Tomas Varela
Current Estimated Value
Purchase Details
Closed on
Nov 15, 2023
Sold by
Varela Tomas C
Bought by
Varela Tomas C and Varela Matildea
Purchase Details
Closed on
Feb 24, 2009
Sold by
Medeiros Patricia and Catala Juan
Bought by
Varela Thomas C and Varela Maria S
Home Financials for this Owner
Home Financials are based on the most recent Mortgage that was taken out on this home.
Original Mortgage
$145,500
Interest Rate
5.06%
Purchase Details
Closed on
May 17, 1993
Sold by
Moore Joseph T
Bought by
Varela Tomaz C
Create a Home Valuation Report for This Property
The Home Valuation Report is an in-depth analysis detailing your home's value as well as a comparison with similar homes in the area
Home Values in the Area
Average Home Value in this Area
Purchase History
| Date | Buyer | Sale Price | Title Company |
|---|---|---|---|
| Tomas C Varela T C | -- | None Available | |
| Varela Tomas C | -- | None Available | |
| Varela Thomas C | $60,000 | -- | |
| Varela Tomaz C | $15,000 | -- |
Source: Public Records
Mortgage History
| Date | Status | Borrower | Loan Amount |
|---|---|---|---|
| Previous Owner | Varela Tomaz C | $145,500 | |
| Previous Owner | Varela Tomaz C | $100,000 |
Source: Public Records
Tax History Compared to Growth
Tax History
| Year | Tax Paid | Tax Assessment Tax Assessment Total Assessment is a certain percentage of the fair market value that is determined by local assessors to be the total taxable value of land and additions on the property. | Land | Improvement |
|---|---|---|---|---|
| 2025 | $3,200 | $380,900 | $123,900 | $257,000 |
| 2024 | $5,173 | $281,900 | $78,500 | $203,400 |
| 2023 | $5,173 | $281,900 | $78,500 | $203,400 |
| 2022 | $5,018 | $281,900 | $78,500 | $203,400 |
| 2021 | $4,480 | $182,400 | $36,900 | $145,500 |
| 2020 | $4,480 | $182,400 | $36,900 | $145,500 |
| 2019 | $4,480 | $182,400 | $36,900 | $145,500 |
| 2018 | $4,014 | $125,600 | $33,600 | $92,000 |
| 2017 | $4,014 | $125,600 | $33,600 | $92,000 |
| 2016 | $4,011 | $125,500 | $33,500 | $92,000 |
| 2015 | $4,042 | $122,100 | $33,500 | $88,600 |
| 2014 | $4,121 | $122,100 | $33,500 | $88,600 |
| 2013 | $4,121 | $122,100 | $33,500 | $88,600 |
Source: Public Records
Map
Nearby Homes