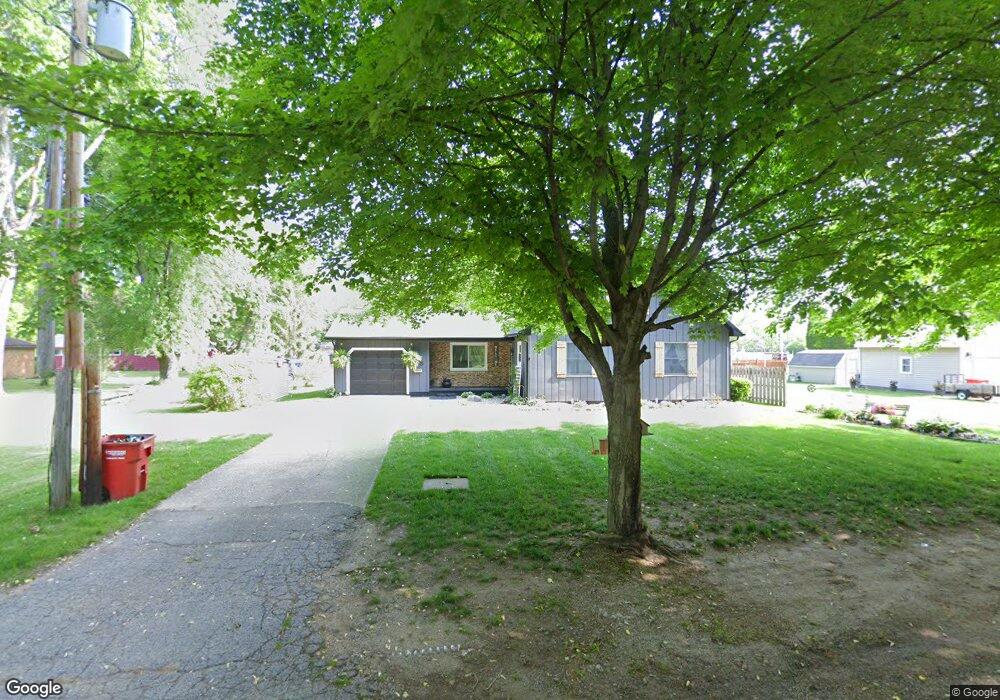
195 Cherry St Constantine, MI 49042
Estimated Value: $186,000 - $248,000
4
Beds
2
Baths
1,828
Sq Ft
$118/Sq Ft
Est. Value
About This Home
This home is located at 195 Cherry St, Constantine, MI 49042 and is currently estimated at $215,136, approximately $117 per square foot. 195 Cherry St is a home located in St. Joseph County with nearby schools including Eastside Elementary School, Riverside Elementary School, and Constantine Middle School.
Ownership History
Date
Name
Owned For
Owner Type
Purchase Details
Closed on
Mar 8, 2011
Sold by
Secretary Of Housing & Urban Development
Bought by
Ford Jason D
Current Estimated Value
Home Financials for this Owner
Home Financials are based on the most recent Mortgage that was taken out on this home.
Original Mortgage
$77,972
Outstanding Balance
$53,776
Interest Rate
4.87%
Mortgage Type
FHA
Estimated Equity
$161,360
Purchase Details
Closed on
Aug 11, 2010
Sold by
Midfirst Bank
Bought by
The Secretary Of Housing & Urban Develop
Purchase Details
Closed on
Jan 7, 2010
Sold by
Stacey Joseph M and Stacey Christine
Bought by
Midfirst Bank
Purchase Details
Closed on
Sep 22, 2004
Sold by
Begeman Joan E and Begeman Rodney B
Bought by
Stacey Joseph M and Stacey Christine
Home Financials for this Owner
Home Financials are based on the most recent Mortgage that was taken out on this home.
Original Mortgage
$125,484
Interest Rate
5.93%
Mortgage Type
FHA
Purchase Details
Closed on
Feb 13, 1995
Purchase Details
Closed on
Jan 1, 1901
Create a Home Valuation Report for This Property
The Home Valuation Report is an in-depth analysis detailing your home's value as well as a comparison with similar homes in the area
Purchase History
| Date | Buyer | Sale Price | Title Company |
|---|---|---|---|
| Ford Jason D | $80,000 | None Available | |
| The Secretary Of Housing & Urban Develop | -- | None Available | |
| Midfirst Bank | $155,295 | None Available | |
| Stacey Joseph M | $126,500 | -- | |
| -- | -- | -- | |
| -- | -- | -- |
Source: Public Records
Mortgage History
| Date | Status | Borrower | Loan Amount |
|---|---|---|---|
| Open | Ford Jason D | $77,972 | |
| Previous Owner | Stacey Joseph M | $125,484 |
Source: Public Records
Tax History
| Year | Tax Paid | Tax Assessment Tax Assessment Total Assessment is a certain percentage of the fair market value that is determined by local assessors to be the total taxable value of land and additions on the property. | Land | Improvement |
|---|---|---|---|---|
| 2025 | $1,522 | $96,100 | $6,800 | $89,300 |
| 2024 | $1,449 | $90,300 | $6,000 | $84,300 |
| 2023 | $575 | $77,500 | $5,400 | $72,100 |
| 2022 | $611 | $70,900 | $5,400 | $65,500 |
| 2021 | $692 | $60,600 | $6,000 | $54,600 |
| 2020 | $1,207 | $53,600 | $6,000 | $47,600 |
| 2019 | $2,097 | $49,100 | $6,000 | $43,100 |
| 2018 | $1,988 | $47,600 | $6,000 | $41,600 |
| 2017 | $1,973 | $48,500 | $48,500 | $0 |
| 2016 | -- | $48,400 | $48,400 | $0 |
| 2015 | -- | $50,800 | $0 | $0 |
| 2014 | -- | $47,300 | $47,300 | $0 |
| 2012 | -- | $44,800 | $44,800 | $0 |
Source: Public Records
Map
Nearby Homes
- 365 White Pigeon St
- 380 Centreville Rd
- 460 Green St
- 130 E Water St
- 265 W Water St
- 135 Jeremy St
- 303 Spring St
- 67234 Blue School Rd
- 64588 W North Park Dr
- 13540 Riverside Dr
- 66991 Winding River Rd
- 67118 Oxbow Dr
- 12901 Millers Mill Rd
- 106 Prairie Ave
- 200 E Chicago Rd
- 210 S State St
- 212 S State St
- 104 W Hotchin Ave
- 505 E Chicago Rd
- 408 Heath Ave
- 150 Cherry St
- 134 Cherry St
- 180 Cherry St
- 130 Cherry St
- 915 White Pigeon Rd
- 925 White Pigeon Rd
- 925 White Pigeon Rd
- 145 Cherry St
- 190 Cherry St
- 825 White Pigeon Rd
- 120 Cherry St
- 125 Cherry St
- 200 Cherry St
- 940 White Pigeon Rd
- 360 E Clinton St
- 815 White Pigeon Rd
- 920 White Pigeon Rd
- 880 White Pigeon Rd
- 420 E Clinton St
- 945 S Washington St
Your Personal Tour Guide
Ask me questions while you tour the home.