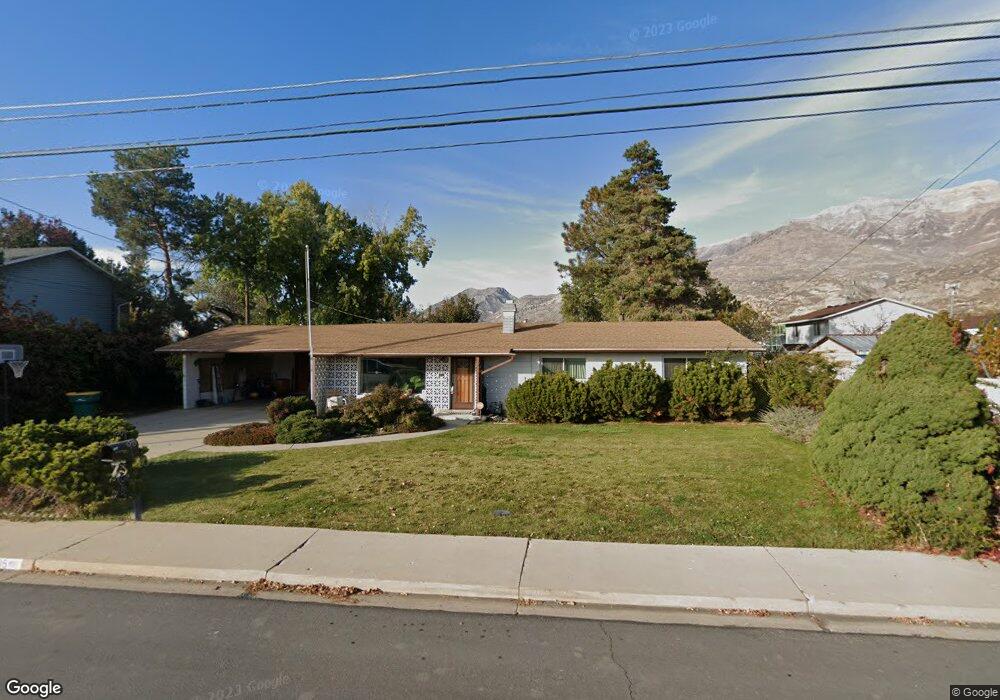
195 E 1200 N Orem, UT 84057
Windsor NeighborhoodEstimated Value: $562,000 - $573,000
3
Beds
2
Baths
1,934
Sq Ft
$293/Sq Ft
Est. Value
About This Home
This home is located at 195 E 1200 N, Orem, UT 84057 and is currently estimated at $567,068, approximately $293 per square foot. 195 E 1200 N is a home located in Utah County with nearby schools including Windsor School, Canyon View Junior High School, and Timpanogos High School.
Ownership History
Date
Name
Owned For
Owner Type
Purchase Details
Closed on
Jul 18, 2019
Sold by
Flygare John Kay and Flygare Lenard Bruce
Bought by
Gille Afton
Current Estimated Value
Home Financials for this Owner
Home Financials are based on the most recent Mortgage that was taken out on this home.
Original Mortgage
$266,500
Outstanding Balance
$233,478
Interest Rate
3.82%
Mortgage Type
New Conventional
Estimated Equity
$333,590
Purchase Details
Closed on
Jan 5, 2007
Sold by
Flygare Flora H and Flygare John W
Bought by
Flygare John Kay and Flygare Lenara Bruce
Home Financials for this Owner
Home Financials are based on the most recent Mortgage that was taken out on this home.
Original Mortgage
$285,000
Interest Rate
6.49%
Mortgage Type
Reverse Mortgage Home Equity Conversion Mortgage
Purchase Details
Closed on
Feb 10, 1997
Sold by
Flygare John W and Flygare Flora H
Bought by
Flygare John Kay and Flygare Lenard Bruce
Create a Home Valuation Report for This Property
The Home Valuation Report is an in-depth analysis detailing your home's value as well as a comparison with similar homes in the area
Home Values in the Area
Average Home Value in this Area
Purchase History
| Date | Buyer | Sale Price | Title Company |
|---|---|---|---|
| Gille Afton | -- | Cottonwood Ttl Ins Agcy Inc | |
| Flygare John Kay | -- | First American Title Pine | |
| Flygare John W | -- | First American Title Pine | |
| Flygare John Kay | -- | -- |
Source: Public Records
Mortgage History
| Date | Status | Borrower | Loan Amount |
|---|---|---|---|
| Open | Gille Afton | $266,500 | |
| Previous Owner | Flygare John W | $285,000 |
Source: Public Records
Tax History
| Year | Tax Paid | Tax Assessment Tax Assessment Total Assessment is a certain percentage of the fair market value that is determined by local assessors to be the total taxable value of land and additions on the property. | Land | Improvement |
|---|---|---|---|---|
| 2025 | $2,221 | $279,125 | -- | -- |
| 2024 | $2,221 | $271,590 | $0 | $0 |
| 2023 | $2,072 | $272,360 | $0 | $0 |
| 2022 | $2,094 | $266,640 | $0 | $0 |
| 2021 | $1,714 | $330,500 | $173,300 | $157,200 |
| 2020 | $1,544 | $292,700 | $138,600 | $154,100 |
| 2019 | $1,390 | $274,000 | $125,600 | $148,400 |
| 2018 | $1,347 | $253,600 | $121,200 | $132,400 |
| 2017 | $1,277 | $128,865 | $0 | $0 |
| 2016 | $1,224 | $113,905 | $0 | $0 |
| 2015 | $1,148 | $101,035 | $0 | $0 |
| 2014 | $1,097 | $96,085 | $0 | $0 |
Source: Public Records
Map
Nearby Homes
- 1371 N 330 E Unit 8
- 372 E 1165 N
- 363 E 1395 N Unit 22
- 917 N Garden Dr
- 16 E 925 N
- 1480 N 430 E
- 1636 N 160 E
- 1638 N 160 E
- 789 200 E Unit 787
- 125 W 870 N
- 287 W 1380 N
- 976 N 560 E
- 362 E 800 N Unit 1
- 723 E 1450 N Unit 25
- 332 W Amiron Way Unit D
- 1548 N 275 West St Unit 2
- 710 E 1280 N
- 1566 N 275 West St Unit 1
- 1547 N 275 West St Unit 5
- 713 E 1450 N Unit 23
Your Personal Tour Guide
Ask me questions while you tour the home.