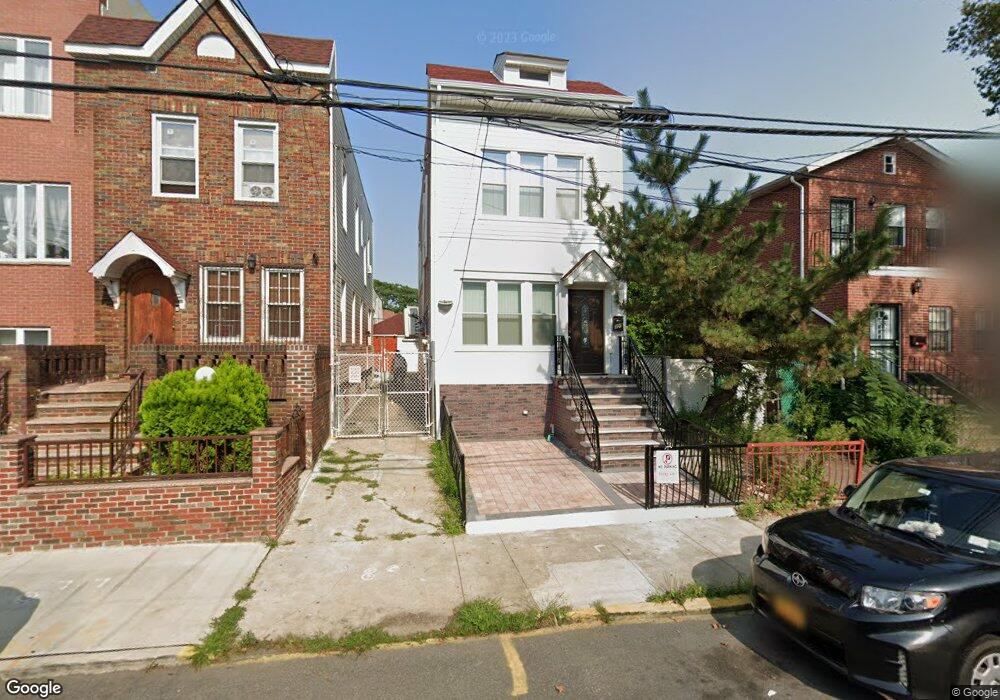
195 E 55th St Brooklyn, NY 11203
East Flatbush NeighborhoodEstimated Value: $678,000 - $742,000
Studio
--
Bath
1,344
Sq Ft
$524/Sq Ft
Est. Value
About This Home
This home is located at 195 E 55th St, Brooklyn, NY 11203 and is currently estimated at $704,005, approximately $523 per square foot. 195 E 55th St is a home located in Kings County with nearby schools including Ps 244 Richard R Green, East Flatbush Community Research School, and Lamad Academy Charter School.
Ownership History
Date
Name
Owned For
Owner Type
Purchase Details
Closed on
Dec 7, 2017
Sold by
Y A S 2003 Development Corp
Bought by
Wahab Eman S
Current Estimated Value
Home Financials for this Owner
Home Financials are based on the most recent Mortgage that was taken out on this home.
Original Mortgage
$522,500
Outstanding Balance
$439,899
Interest Rate
3.94%
Mortgage Type
Purchase Money Mortgage
Estimated Equity
$264,106
Purchase Details
Closed on
Sep 15, 2016
Sold by
Moore Geraldine
Bought by
Y A S 2003 Development Corp
Create a Home Valuation Report for This Property
The Home Valuation Report is an in-depth analysis detailing your home's value as well as a comparison with similar homes in the area
Home Values in the Area
Average Home Value in this Area
Purchase History
| Date | Buyer | Sale Price | Title Company |
|---|---|---|---|
| Wahab Eman S | $550,000 | -- | |
| Y A S 2003 Development Corp | $215,000 | -- |
Source: Public Records
Mortgage History
| Date | Status | Borrower | Loan Amount |
|---|---|---|---|
| Open | Wahab Eman S | $522,500 |
Source: Public Records
Tax History
| Year | Tax Paid | Tax Assessment Tax Assessment Total Assessment is a certain percentage of the fair market value that is determined by local assessors to be the total taxable value of land and additions on the property. | Land | Improvement |
|---|---|---|---|---|
| 2025 | $5,165 | $41,520 | $12,420 | $29,100 |
| 2024 | $5,165 | $38,400 | $12,420 | $25,980 |
| 2023 | $4,928 | $37,500 | $12,420 | $25,080 |
| 2022 | $4,570 | $39,720 | $12,420 | $27,300 |
| 2021 | $3,629 | $36,540 | $12,420 | $24,120 |
| 2019 | $4,483 | $32,100 | $12,420 | $19,680 |
| 2018 | $4,122 | $20,220 | $8,666 | $11,554 |
| 2017 | $3,889 | $19,076 | $8,244 | $10,832 |
| 2016 | $3,813 | $19,076 | $9,538 | $9,538 |
| 2015 | $2,171 | $18,931 | $13,115 | $5,816 |
| 2014 | $2,171 | $17,860 | $12,877 | $4,983 |
Source: Public Records
Map
Nearby Homes
- 175 E 55th St
- 255 E 55th St
- 886 Linden Blvd Unit 888
- 890 Linden Blvd
- 234 E 54th St
- 871 Linden Blvd
- 891 Linden Blvd
- 5749 Kings Hwy
- 5727 Kings Hwy
- 814 Linden Blvd
- 5606 Snyder Ave
- 355 E 51st St
- 206 E 53rd St
- 343 E 51st St
- 342 E 55th St
- 895 Lenox Rd
- 435 E 51st St
- 455 E 51st St
- 162 E 59th St
- 828 Lenox Rd
Your Personal Tour Guide
Ask me questions while you tour the home.