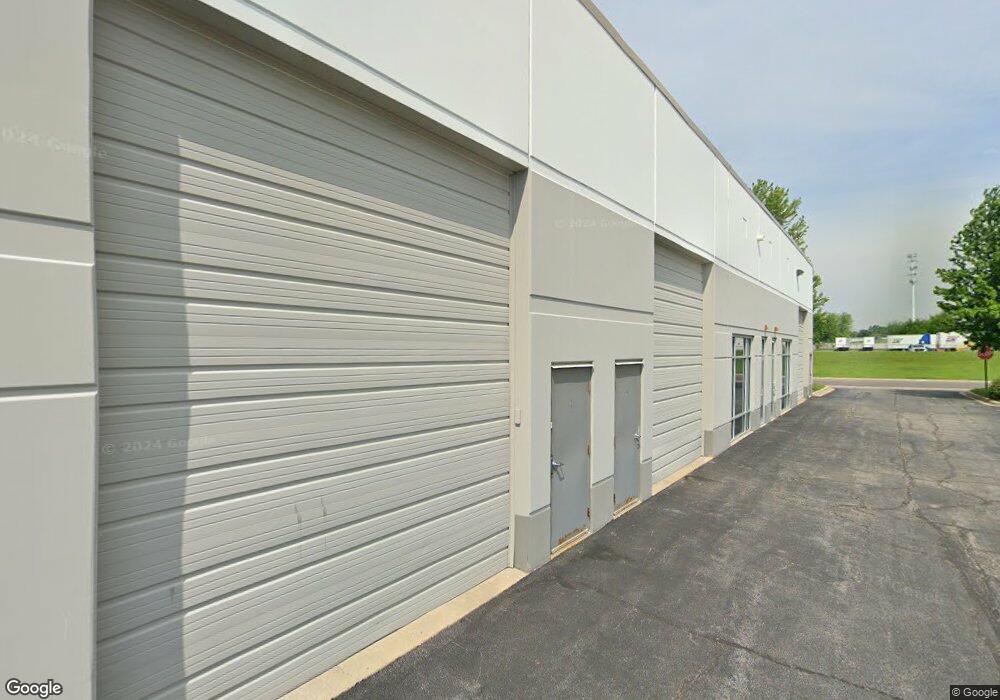
195 Kendall Point Dr Unit 2 Oswego, IL 60543
North Oswego NeighborhoodEstimated Value: $202,621
--
Bed
--
Bath
1,530
Sq Ft
$132/Sq Ft
Est. Value
About This Home
This home is located at 195 Kendall Point Dr Unit 2, Oswego, IL 60543 and is currently estimated at $202,621, approximately $132 per square foot. 195 Kendall Point Dr Unit 2 is a home located in Kendall County with nearby schools including Long Beach Elementary School, Plank Junior High School, and Oswego East High School.
Ownership History
Date
Name
Owned For
Owner Type
Purchase Details
Closed on
Oct 30, 2023
Sold by
Venetian Llc
Bought by
Kbs Properties Llc
Current Estimated Value
Home Financials for this Owner
Home Financials are based on the most recent Mortgage that was taken out on this home.
Original Mortgage
$315,000
Interest Rate
6.5%
Mortgage Type
New Conventional
Purchase Details
Closed on
Nov 7, 2019
Sold by
Shree Partners Lp
Bought by
Venetian Llc
Purchase Details
Closed on
Jul 31, 2012
Sold by
Us Partners Lp
Bought by
Shree Partners Lp
Purchase Details
Closed on
Nov 7, 2006
Sold by
Rptr Llc
Bought by
Us Partners Lp
Home Financials for this Owner
Home Financials are based on the most recent Mortgage that was taken out on this home.
Original Mortgage
$119,000
Interest Rate
6.47%
Mortgage Type
Commercial
Create a Home Valuation Report for This Property
The Home Valuation Report is an in-depth analysis detailing your home's value as well as a comparison with similar homes in the area
Home Values in the Area
Average Home Value in this Area
Purchase History
| Date | Buyer | Sale Price | Title Company |
|---|---|---|---|
| Kbs Properties Llc | $420,000 | Citywide Title | |
| Venetian Llc | $124,000 | Altima Title Llc | |
| Shree Partners Lp | $112,500 | None Available | |
| Us Partners Lp | $160,000 | Chicago Title Insurance Co |
Source: Public Records
Mortgage History
| Date | Status | Borrower | Loan Amount |
|---|---|---|---|
| Previous Owner | Kbs Properties Llc | $315,000 | |
| Previous Owner | Us Partners Lp | $119,000 |
Source: Public Records
Tax History Compared to Growth
Tax History
| Year | Tax Paid | Tax Assessment Tax Assessment Total Assessment is a certain percentage of the fair market value that is determined by local assessors to be the total taxable value of land and additions on the property. | Land | Improvement |
|---|---|---|---|---|
| 2024 | $1,649 | $20,492 | $3,657 | $16,835 |
| 2023 | $1,934 | $20,492 | $3,657 | $16,835 |
| 2022 | $1,906 | $21,106 | $4,271 | $16,835 |
| 2021 | $1,975 | $21,106 | $4,271 | $16,835 |
| 2020 | $1,994 | $21,106 | $4,271 | $16,835 |
| 2019 | $2,026 | $21,106 | $4,271 | $16,835 |
| 2018 | $2,269 | $31,473 | $4,075 | $27,398 |
| 2017 | $1,393 | $13,588 | $4,075 | $9,513 |
| 2016 | $1,413 | $13,588 | $4,075 | $9,513 |
| 2015 | $2,935 | $31,473 | $4,075 | $27,398 |
| 2014 | -- | $31,473 | $4,075 | $27,398 |
| 2013 | -- | $31,473 | $4,075 | $27,398 |
Source: Public Records
Map
Nearby Homes
- 295 Springbrook Trail S
- 0000 Fifth St
- 235 Springbrook Trail S Unit 1
- 22 Alex Ct Unit 1
- BELLAMY Plan at Marquis Pointe
- HOLCOMBE Plan at Marquis Pointe
- SIENNA Plan at Marquis Pointe
- HENLEY Plan at Marquis Pointe
- 962 Garnet Ln
- 121 Springbrook Trail S
- 712 Bohannon Cir
- 2071 Wiesbrook Dr
- 966 Garnet Ln
- 970 Garnet Ln
- 974 Garnet Ln
- 978 Garnet Ln
- 982 Garnet Ln
- 334 Ogden Falls Blvd
- 986 Garnet Ln
- 994 Garnet Ln
- 195 Kendall Point Dr Unit 1
- 195 Kendall Point Dr Unit 3
- 195 Kendall Point Dr Unit 15
- 2 Kirkland Cir
- 225 Kendall Point Dr
- 150 Kendall Point Dr Unit C
- 150 Kendall Point Dr Unit G
- 150 Kendall Point Dr Unit F
- 150 Kendall Point Dr Unit H
- 150 Kendall Point Dr Unit EF
- 150 Kendall Point Dr Unit E
- 165 Kirkland Cir
- 155 Kirkland Cir Unit 200
- 155 Kirkland Cir Unit 600
- 155 Kirkland Cir Unit 500
- 155 Kirkland Cir Unit 400
- 155 Kirkland Cir Unit 300
- 155 Kirkland Cir Unit 400-500
- 155 Kirkland Cir
- 174 Kirkland Cir