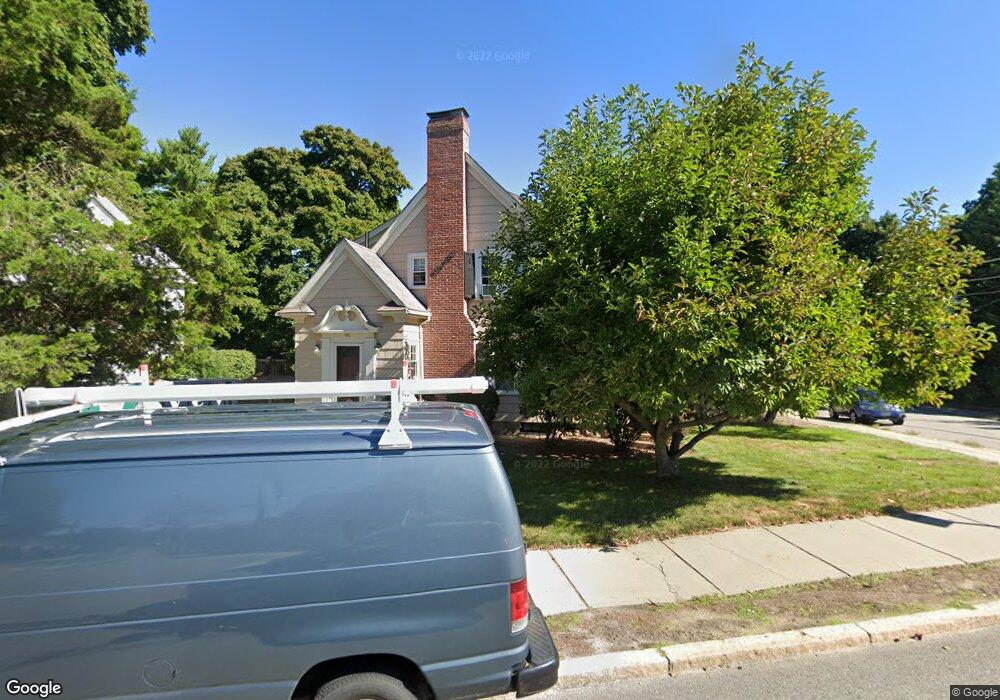
195 Lagrange St West Roxbury, MA 02132
Bellevue Hill NeighborhoodEstimated Value: $748,021 - $906,000
3
Beds
2
Baths
1,210
Sq Ft
$671/Sq Ft
Est. Value
About This Home
This home is located at 195 Lagrange St, West Roxbury, MA 02132 and is currently estimated at $812,505, approximately $671 per square foot. 195 Lagrange St is a home located in Suffolk County with nearby schools including St Theresa School, Holy Name Parish School, and The Roxbury Latin School.
Ownership History
Date
Name
Owned For
Owner Type
Purchase Details
Closed on
May 13, 2016
Sold by
Price Brendan D and Halpin Mary B
Bought by
Price-Halpin Ft
Current Estimated Value
Purchase Details
Closed on
Dec 30, 1993
Sold by
Wallace Christopher M and Wallace Tamsin J
Bought by
Price Brendan D and Halpin Mary B
Purchase Details
Closed on
Dec 29, 1989
Sold by
Healey Richard T
Bought by
Wallace Christopher M
Create a Home Valuation Report for This Property
The Home Valuation Report is an in-depth analysis detailing your home's value as well as a comparison with similar homes in the area
Home Values in the Area
Average Home Value in this Area
Purchase History
| Date | Buyer | Sale Price | Title Company |
|---|---|---|---|
| Price-Halpin Ft | -- | -- | |
| Price Brendan D | $172,000 | -- | |
| Wallace Christopher M | $174,000 | -- |
Source: Public Records
Mortgage History
| Date | Status | Borrower | Loan Amount |
|---|---|---|---|
| Previous Owner | Wallace Christopher M | $146,000 | |
| Previous Owner | Wallace Christopher M | $160,000 | |
| Previous Owner | Wallace Christopher M | $145,000 |
Source: Public Records
Tax History Compared to Growth
Tax History
| Year | Tax Paid | Tax Assessment Tax Assessment Total Assessment is a certain percentage of the fair market value that is determined by local assessors to be the total taxable value of land and additions on the property. | Land | Improvement |
|---|---|---|---|---|
| 2025 | $7,357 | $635,300 | $242,900 | $392,400 |
| 2024 | $6,908 | $633,800 | $266,900 | $366,900 |
| 2023 | $6,237 | $580,700 | $251,800 | $328,900 |
| 2022 | $5,744 | $527,900 | $228,900 | $299,000 |
| 2021 | $5,410 | $507,000 | $222,200 | $284,800 |
| 2020 | $4,689 | $444,000 | $201,100 | $242,900 |
| 2019 | $4,369 | $414,500 | $167,500 | $247,000 |
| 2018 | $4,135 | $394,600 | $167,500 | $227,100 |
| 2017 | $4,135 | $390,500 | $167,500 | $223,000 |
| 2016 | $4,052 | $368,400 | $167,500 | $200,900 |
| 2015 | $4,417 | $364,700 | $162,700 | $202,000 |
| 2014 | $4,283 | $340,500 | $162,700 | $177,800 |
Source: Public Records
Map
Nearby Homes
- 145 Lagrange St
- 275 Bellevue St
- 12 Loyola Cir
- 73 Woodard Rd
- 12 Eagle St
- 348 Lagrange St
- 54 Sturges Rd
- 50 Heron St
- 35 Heron St
- 2 Lagrange St Unit 4
- 152 Stratford St
- 4873 Washington St Unit 1
- 14 Starling St
- 10 Starling St
- 425 Lagrange St Unit 203
- 2231 Centre St
- 4959 Washington St
- 27-29 Temple St
- 4975 Washington St Unit 306
- 4975 Washington St Unit 311