Estimated Value: $592,842 - $693,000
About This Home
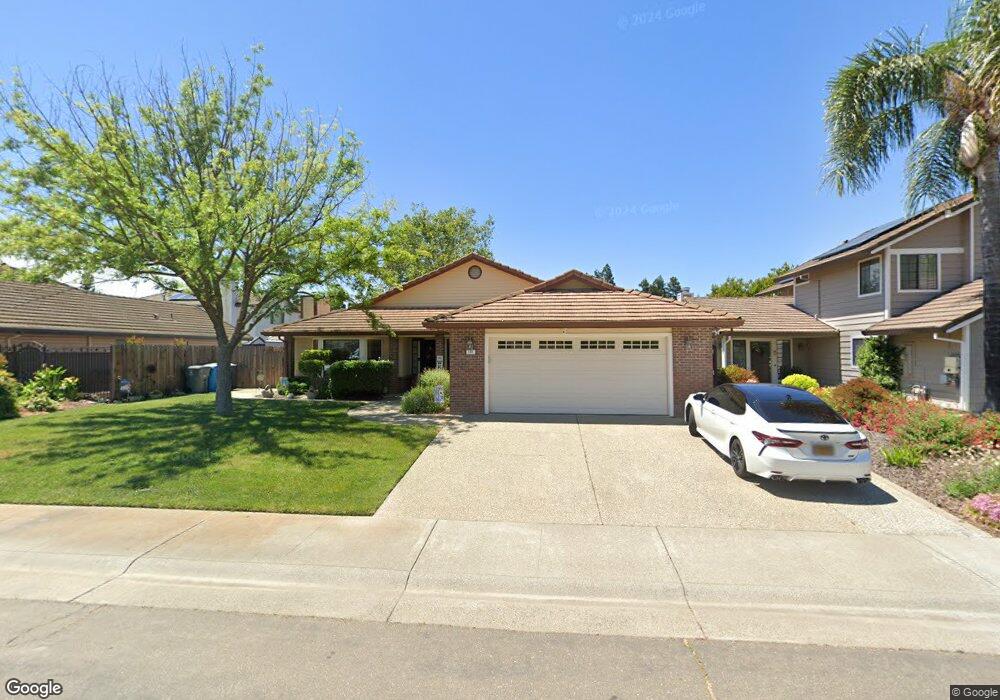
This home is located at 195 Lynd Way, Dixon, CA 95620 and is currently estimated at $632,961, approximately $312 per square foot. 195 Lynd Way is a home located in Solano County with nearby schools including Tremont Elementary School, Dixon High School, and Dixon Montessori Charter.
Ownership History
We collect this data history from publicly available records. To have your information removed, we recommend requesting removal directly through your county’s website.
Purchase Details
Purchase Details
Home Financials for this Owner
Home Financials are based on the most recent Mortgage that was taken out on this home.Home Values in the Area
Average Home Value in this Area
Purchase History
We collect this data history from publicly available records. To have your information removed, we recommend requesting removal directly through your county’s website.
| Date | Buyer | Sale Price | Title Company |
|---|---|---|---|
| -- | None Available | ||
| -- | Old Republic Title Company |
Mortgage History
We collect this data history from publicly available records. To have your information removed, we recommend requesting removal directly through your county’s website.
| Date | Status | Borrower | Loan Amount |
|---|---|---|---|
| Closed | $292,000 |
Tax History
We collect this data history from publicly available records. To have your information removed, we recommend requesting removal directly through your county’s website.
| Year | Tax Paid | Tax Assessment Tax Assessment Total Assessment is a certain percentage of the fair market value that is determined by local assessors to be the total taxable value of land and additions on the property. | Land | Improvement |
|---|---|---|---|---|
| 2025 | $4,239 | $372,751 | $104,021 | $268,730 |
| 2024 | $4,239 | $365,443 | $101,982 | $263,461 |
| 2023 | $4,114 | $358,279 | $99,983 | $258,296 |
| 2022 | $4,052 | $351,255 | $98,023 | $253,232 |
| 2021 | $4,001 | $344,368 | $96,101 | $248,267 |
| 2020 | $3,936 | $340,838 | $95,116 | $245,722 |
| 2019 | $3,862 | $334,155 | $93,251 | $240,904 |
| 2018 | $3,844 | $327,604 | $91,423 | $236,181 |
| 2017 | $3,748 | $321,181 | $89,631 | $231,550 |
| 2016 | $3,586 | $314,884 | $87,874 | $227,010 |
| 2015 | $3,504 | $310,156 | $86,555 | $223,601 |
| 2014 | $3,465 | $304,081 | $84,860 | $219,221 |
Map
- 1370 Estates Dr
- 1250 Redwood Ct
- 1145 Woodvale Dr
- 215 Bluemoor Dr
- 235 Bluemoor Dr
- 1355 Hemingway Ct
- 345 Alderglen Dr
- 255 Bluemoor Dr
- 1360 Hemingway Ct
- 335 Bluemoor Dr
- 1535 Eisenhower Ct
- 1545 Patton Ct
- 1430 Roosevelt St
- 345 Bluemoor Dr
- 320 Bluemoor Dr
- 355 Bluemoor Dr
- 580 Wildflower Ct
- 970 Camelia Dr
- 1445 Goldfield Ln
- 580 W B St
Ask me questions while you tour the home.