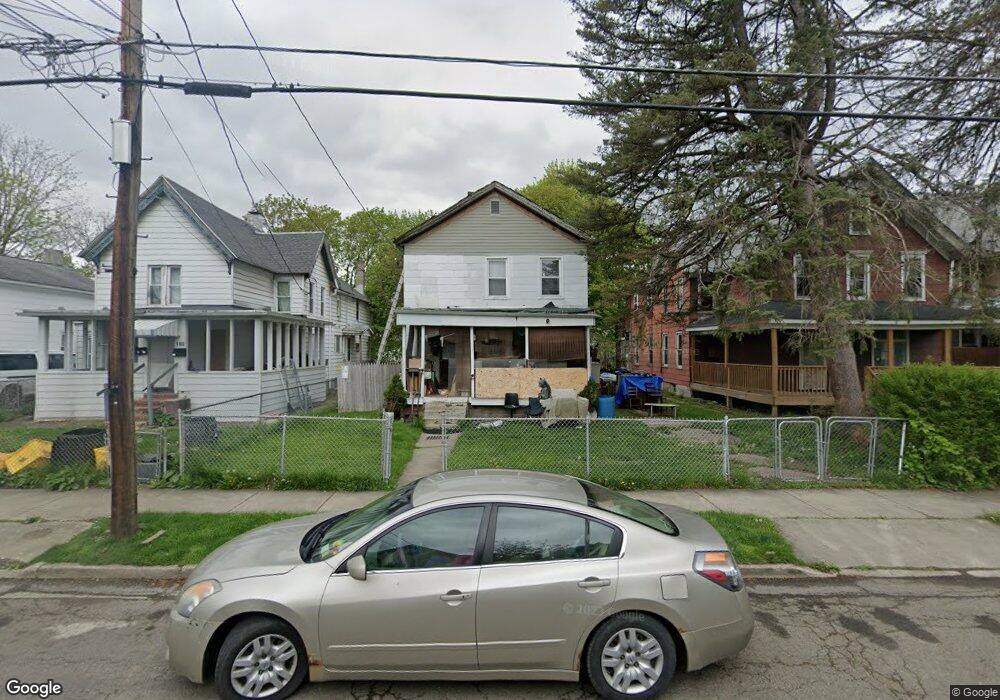
195 Oak St Binghamton, NY 13905
First Ward NeighborhoodEstimated Value: $81,000 - $130,000
3
Beds
2
Baths
1,936
Sq Ft
$57/Sq Ft
Est. Value
About This Home
This home is located at 195 Oak St, Binghamton, NY 13905 and is currently estimated at $109,798, approximately $56 per square foot. 195 Oak St is a home located in Broome County with nearby schools including Binghamton High School, Woodrow Wilson Elementary School, and West Middle School.
Ownership History
Date
Name
Owned For
Owner Type
Purchase Details
Closed on
Nov 5, 2014
Sold by
Mcintyre Patrick A
Bought by
Pavlik David R
Current Estimated Value
Purchase Details
Closed on
May 3, 2013
Sold by
Little Kevin and Little Laura
Bought by
Mcintyre Patrick A
Purchase Details
Closed on
Mar 12, 2009
Sold by
Bank Of New York As Trustee
Bought by
Little Kevin
Purchase Details
Closed on
Oct 24, 2008
Sold by
Tasber Ronald
Bought by
Bank Of New York
Purchase Details
Closed on
Oct 25, 2002
Sold by
Babicek Rose Trust
Bought by
Tasber Ronald
Create a Home Valuation Report for This Property
The Home Valuation Report is an in-depth analysis detailing your home's value as well as a comparison with similar homes in the area
Home Values in the Area
Average Home Value in this Area
Purchase History
| Date | Buyer | Sale Price | Title Company |
|---|---|---|---|
| Pavlik David R | -- | None Available | |
| Mcintyre Patrick A | $5,000 | None Available | |
| Little Kevin | $22,500 | Kevin Yeager | |
| Bank Of New York | $500 | Steven Baum | |
| Tasber Ronald | $11,000 | Stephen B Atkinson |
Source: Public Records
Tax History Compared to Growth
Tax History
| Year | Tax Paid | Tax Assessment Tax Assessment Total Assessment is a certain percentage of the fair market value that is determined by local assessors to be the total taxable value of land and additions on the property. | Land | Improvement |
|---|---|---|---|---|
| 2024 | $3,597 | $56,000 | $7,400 | $48,600 |
| 2023 | $5,418 | $56,000 | $7,400 | $48,600 |
| 2022 | $5,291 | $56,000 | $7,400 | $48,600 |
| 2021 | $5,232 | $56,000 | $7,400 | $48,600 |
| 2020 | $3,004 | $56,000 | $7,400 | $48,600 |
| 2019 | $1,766 | $56,000 | $7,400 | $48,600 |
| 2018 | $2,702 | $56,000 | $7,400 | $48,600 |
| 2017 | $2,733 | $56,000 | $7,400 | $48,600 |
| 2016 | $3,020 | $56,000 | $7,400 | $48,600 |
| 2015 | $3,308 | $58,000 | $7,400 | $50,600 |
| 2014 | $3,308 | $58,000 | $7,400 | $50,600 |
Source: Public Records
Map
Nearby Homes