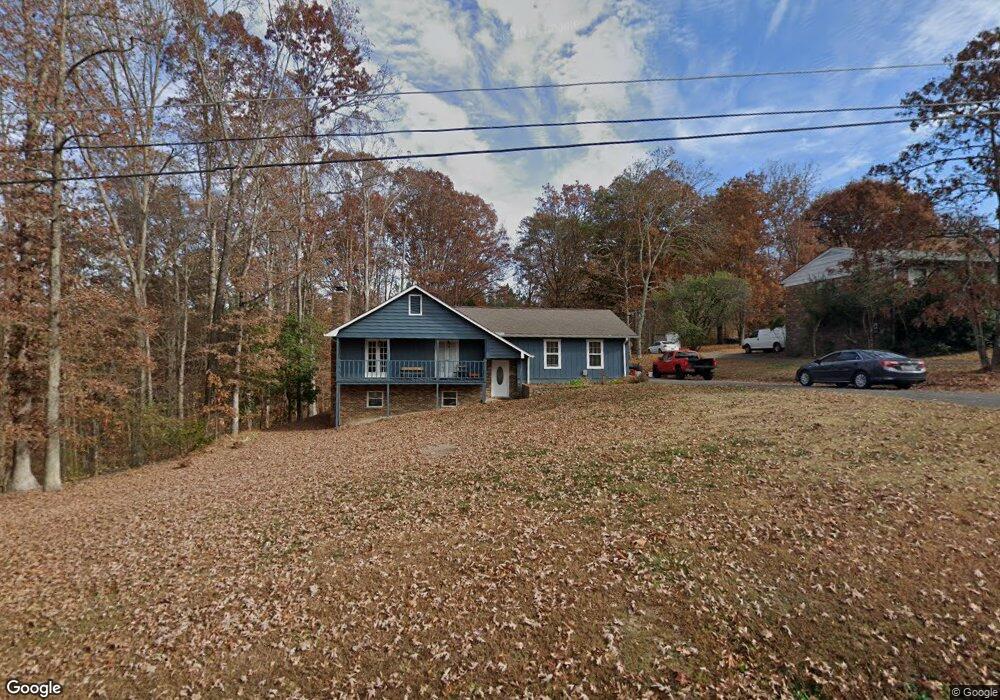
195 Ridge Top Rd Dunlap, TN 37327
Estimated Value: $219,830 - $330,000
--
Bed
3
Baths
1,459
Sq Ft
$191/Sq Ft
Est. Value
About This Home
This home is located at 195 Ridge Top Rd, Dunlap, TN 37327 and is currently estimated at $278,708, approximately $191 per square foot. 195 Ridge Top Rd is a home located in Sequatchie County with nearby schools including Griffith Elementary School, Sequatchie County Middle School, and Sequatchie County High School.
Ownership History
Date
Name
Owned For
Owner Type
Purchase Details
Closed on
Jul 30, 2008
Sold by
Tomas Duenas
Bought by
Greendahl Robert M
Current Estimated Value
Purchase Details
Closed on
Jun 16, 2000
Sold by
Jennifer Harbin
Bought by
Tomas Duenas and Tomas Roxanne
Purchase Details
Closed on
Apr 16, 1999
Sold by
Wayne Trapp Jerry and Wayne Wife
Bought by
Trapp Jerry W
Purchase Details
Closed on
May 11, 1988
Bought by
Trapp Jerry Wayne and Wife Pamela Sue
Purchase Details
Closed on
Jan 1, 1983
Bought by
Wife Austin L and Wife Martha R
Create a Home Valuation Report for This Property
The Home Valuation Report is an in-depth analysis detailing your home's value as well as a comparison with similar homes in the area
Home Values in the Area
Average Home Value in this Area
Purchase History
| Date | Buyer | Sale Price | Title Company |
|---|---|---|---|
| Greendahl Robert M | $102,000 | -- | |
| Tomas Duenas | $90,000 | -- | |
| Jennifer Harbin | -- | -- | |
| Trapp Jerry W | -- | -- | |
| Trapp Jerry Wayne | $58,000 | -- | |
| Wife Austin L | $5,500 | -- |
Source: Public Records
Tax History Compared to Growth
Tax History
| Year | Tax Paid | Tax Assessment Tax Assessment Total Assessment is a certain percentage of the fair market value that is determined by local assessors to be the total taxable value of land and additions on the property. | Land | Improvement |
|---|---|---|---|---|
| 2024 | -- | $47,750 | $5,000 | $42,750 |
| 2023 | $1,153 | $47,750 | $5,000 | $42,750 |
| 2022 | $886 | $26,700 | $3,825 | $22,875 |
| 2021 | $873 | $26,700 | $3,825 | $22,875 |
| 2020 | $873 | $26,700 | $3,825 | $22,875 |
| 2019 | $873 | $26,700 | $3,825 | $22,875 |
| 2018 | $863 | $26,700 | $3,825 | $22,875 |
| 2017 | $853 | $26,700 | $3,825 | $22,875 |
| 2016 | $917 | $27,525 | $3,825 | $23,700 |
| 2015 | $917 | $27,525 | $3,825 | $23,700 |
| 2014 | $917 | $27,525 | $3,825 | $23,700 |
Source: Public Records
Map
Nearby Homes
- 14127 Rankin Ave
- 133 Stagg St
- 13875 Rankin Ave
- 14818 Rankin Ave
- 35 Hummingbird Ln
- 89 Clover Dale Rd S
- 241 Dogwood Ln
- 252 Valley View Dr
- 696 Elm St
- 4944 W Valley Rd
- 870 Ridge Rd
- 1 Countryside Dr
- 0 Countryside Dr Unit 24649631
- 0 Countryside Dr Unit 1310228
- 0 Countryside Dr Unit 238272
- 0 Countryside Dr Unit 20253507
- 0 Countryside Dr Unit 1517709
- 254 Cdl Trail
- 0 Buddy Skyles Tract 1 Rd
- 95 Blue Sky Rd Rd
- 195 Ridgetop Dr
- 225 Ridge Top Rd
- 239 Ridge Top Rd
- 239 Ridgetop Dr
- 249 Ridge Top Rd
- 249 Ridgetop Dr
- 138 Ridgetop Dr
- 150 Ridgetop Dr
- 150 Ridge Top Rd
- 150 Ridge Top Rd
- 202 Ridgetop Dr
- 200 Ridgetop Rd
- 200 Ridge Top Rd
- 212 Ridgetop Dr
- 145 Ridgetop Dr
- 232 Ridgetop Rd
- 232 Ridgetop Rd
- 232 Ridgetop Dr
- 232 Ridge Top Rd
- 14 Ridgetop Dr