195 Steele Rd Unit 38/03 Griffin, GA 30223
Spalding County NeighborhoodEstimated Value: $274,418 - $355,000
3
Beds
2
Baths
2,263
Sq Ft
$141/Sq Ft
Est. Value
About This Home
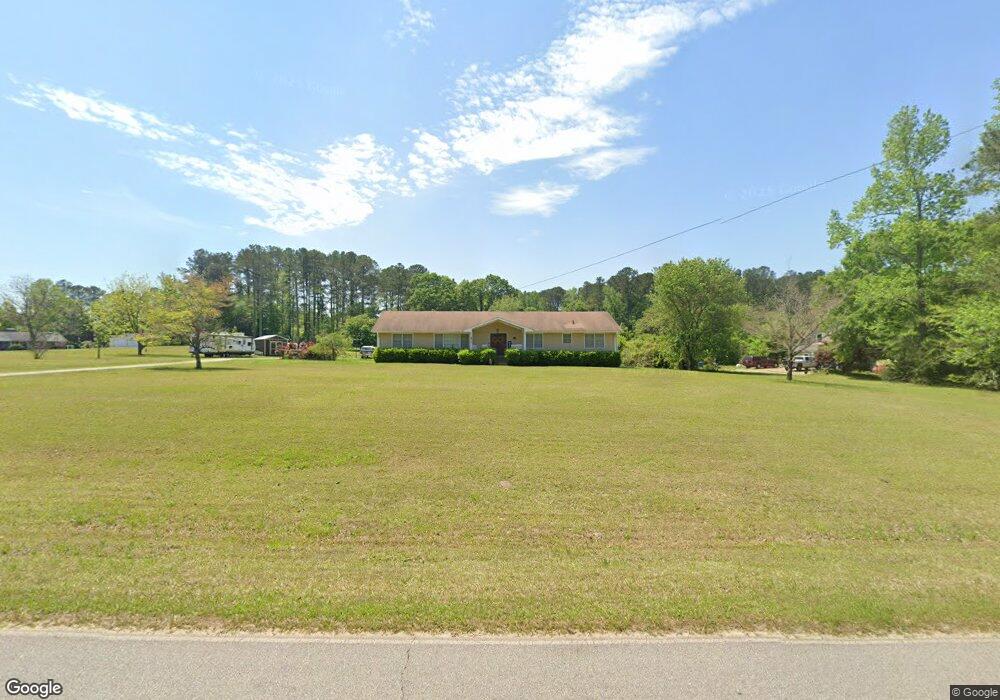
This home is located at 195 Steele Rd Unit 38/03, Griffin, GA 30223 and is currently estimated at $318,855, approximately $140 per square foot. 195 Steele Rd Unit 38/03 is a home located in Spalding County with nearby schools including Cowan Road Elementary School, Cowan Road Middle School, and Griffin High School.
Ownership History
Date
Name
Owned For
Owner Type
Purchase Details
Closed on
Dec 8, 2017
Sold by
Otis Glen
Bought by
Curnell Ebony R
Current Estimated Value
Home Financials for this Owner
Home Financials are based on the most recent Mortgage that was taken out on this home.
Original Mortgage
$181,649
Outstanding Balance
$151,203
Interest Rate
3.87%
Mortgage Type
FHA
Estimated Equity
$167,652
Purchase Details
Closed on
Feb 5, 2007
Sold by
Wetherington Carol J
Bought by
Otis Glen and Otis Connie
Home Financials for this Owner
Home Financials are based on the most recent Mortgage that was taken out on this home.
Original Mortgage
$181,609
Interest Rate
6.08%
Mortgage Type
Stand Alone Second
Purchase Details
Closed on
Sep 8, 1972
Sold by
Robinson P Lewis
Bought by
Wetherington Avon and Wetherington Carol J
Purchase Details
Closed on
Feb 21, 1972
Sold by
Slade Realty Inc
Bought by
Robinson P Lewis
Purchase Details
Closed on
Jul 12, 1971
Sold by
Hamby Ethel Mcmillan
Bought by
Slade Realty Inc
Create a Home Valuation Report for This Property
The Home Valuation Report is an in-depth analysis detailing your home's value as well as a comparison with similar homes in the area
Home Values in the Area
Average Home Value in this Area
Purchase History
| Date | Buyer | Sale Price | Title Company |
|---|---|---|---|
| Curnell Ebony R | $185,000 | -- | |
| Otis Glen | $140,000 | -- | |
| Wetherington Avon | $5,900 | -- | |
| Robinson P Lewis | $15,000 | -- | |
| Slade Realty Inc | $13,800 | -- | |
| Hamby Ethel Mcmillan | -- | -- |
Source: Public Records
Mortgage History
| Date | Status | Borrower | Loan Amount |
|---|---|---|---|
| Open | Curnell Ebony R | $181,649 | |
| Previous Owner | Otis Glen | $181,609 |
Source: Public Records
Tax History
| Year | Tax Paid | Tax Assessment Tax Assessment Total Assessment is a certain percentage of the fair market value that is determined by local assessors to be the total taxable value of land and additions on the property. | Land | Improvement |
|---|---|---|---|---|
| 2025 | $2,749 | $76,846 | $17,798 | $59,048 |
| 2024 | $2,719 | $76,846 | $17,798 | $59,048 |
| 2023 | $2,749 | $76,846 | $17,798 | $59,048 |
| 2022 | $2,384 | $65,558 | $14,239 | $51,319 |
| 2021 | $2,106 | $57,909 | $14,239 | $43,670 |
| 2020 | $2,113 | $57,909 | $14,239 | $43,670 |
| 2019 | $2,155 | $57,909 | $14,239 | $43,670 |
| 2018 | $2,055 | $53,774 | $14,239 | $39,535 |
| 2017 | $1,630 | $49,565 | $14,239 | $35,326 |
| 2016 | $1,659 | $49,565 | $14,239 | $35,326 |
| 2015 | $1,710 | $49,565 | $14,239 | $35,326 |
| 2014 | $1,739 | $49,565 | $14,239 | $35,326 |
Source: Public Records
Map
Nearby Homes
- 265 Steele Rd
- 0 Steele Rd Unit 10680484
- 0 Deason St Unit 23730
- 0 Deason St Unit 10624935
- 1574 Vineyard Rd
- 214 Patriots Way
- 1156 Burgundy Dr
- 1057 Vineyard Rd
- 1055 Vineyard Rd
- 1053 Vineyard Rd
- 225 Vineyard Ridge Dr
- 1051 Vineyard Rd
- 312 Vineyard Ridge Ln
- 1022 Serene Lake Dr
- 114 King Richard Dr
- 410 Ashley Trail
- 123 King Richard Dr
- 906 Steele Rd
- 1836 Pinecrest Dr
- 743 Vineyard Rd
- 195 Steele Rd
- 225 Steele Rd
- 240 Steele Rd
- 243 Steele Rd
- 149 Steele Rd
- 12 Steele Rd
- 10 Steele Rd
- 100 Steele Rd
- 178 Steele Rd
- 113 Steele Rd
- 1415 Vineyard Rd
- 291 Steele Rd
- 248 Steele Rd
- 334 Steele Rd
- 1381 Vineyard Rd
- 499 Steele Rd
- 1457 Vineyard Rd
- 1124 Burgundy Dr
- 1112 Burgundy Dr Unit 2612891-48299
- 1112 Burgundy Dr
Your Personal Tour Guide
Ask me questions while you tour the home.