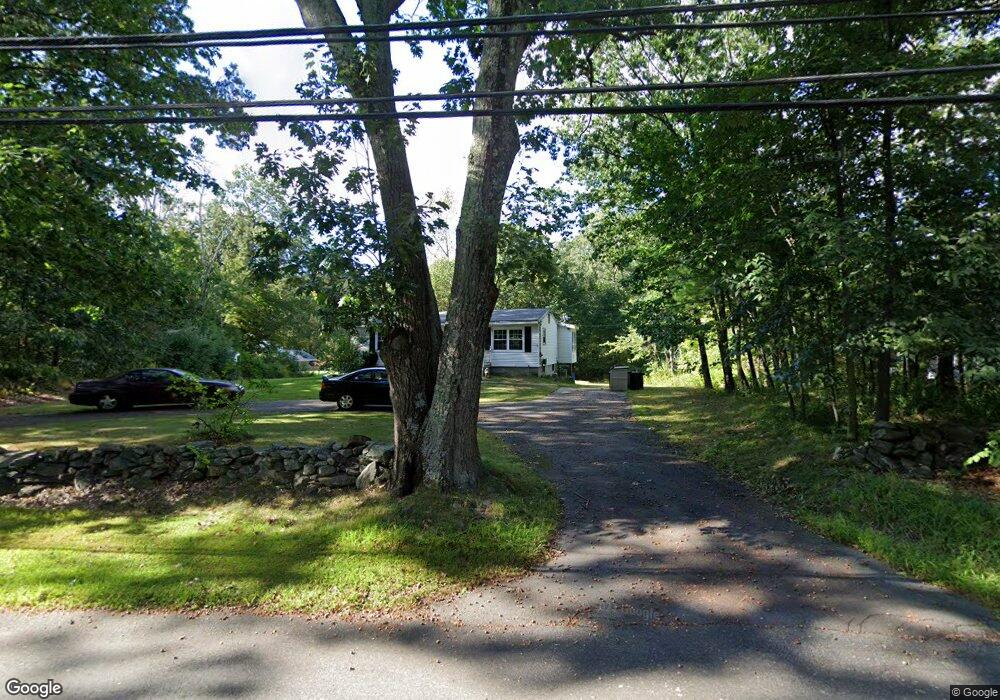
195 Tyler St Methuen, MA 01844
The West End NeighborhoodEstimated Value: $535,094 - $595,000
3
Beds
1
Bath
960
Sq Ft
$579/Sq Ft
Est. Value
About This Home
This home is located at 195 Tyler St, Methuen, MA 01844 and is currently estimated at $556,274, approximately $579 per square foot. 195 Tyler St is a home located in Essex County with nearby schools including Marsh Grammar School, Methuen High School, and The Islamic Academy For Peace.
Ownership History
Date
Name
Owned For
Owner Type
Purchase Details
Closed on
Jan 9, 2017
Sold by
Findeisen Jane and Findeisen Mary
Bought by
Findeisen Mary J
Current Estimated Value
Create a Home Valuation Report for This Property
The Home Valuation Report is an in-depth analysis detailing your home's value as well as a comparison with similar homes in the area
Home Values in the Area
Average Home Value in this Area
Purchase History
| Date | Buyer | Sale Price | Title Company |
|---|---|---|---|
| Findeisen Mary J | -- | -- | |
| Findeisen Mary J | -- | -- | |
| Findeisen Mary J | -- | -- |
Source: Public Records
Mortgage History
| Date | Status | Borrower | Loan Amount |
|---|---|---|---|
| Previous Owner | Findeisen Mary J | $50,000 | |
| Previous Owner | Findeisen Mary J | $56,000 | |
| Previous Owner | Findeisen Mary J | $10,000 |
Source: Public Records
Tax History
| Year | Tax Paid | Tax Assessment Tax Assessment Total Assessment is a certain percentage of the fair market value that is determined by local assessors to be the total taxable value of land and additions on the property. | Land | Improvement |
|---|---|---|---|---|
| 2025 | $5,678 | $536,700 | $308,300 | $228,400 |
| 2024 | $5,629 | $518,300 | $280,300 | $238,000 |
| 2023 | $5,368 | $458,800 | $250,300 | $208,500 |
| 2022 | $5,011 | $384,000 | $200,200 | $183,800 |
| 2021 | $4,722 | $358,000 | $190,200 | $167,800 |
| 2020 | $4,730 | $351,900 | $190,200 | $161,700 |
| 2019 | $4,548 | $320,500 | $180,200 | $140,300 |
| 2018 | $4,469 | $313,200 | $180,200 | $133,000 |
| 2017 | $4,391 | $299,700 | $180,200 | $119,500 |
| 2016 | $4,347 | $293,500 | $180,200 | $113,300 |
| 2015 | $4,231 | $289,800 | $180,200 | $109,600 |
Source: Public Records
Map
Nearby Homes
Your Personal Tour Guide
Ask me questions while you tour the home.