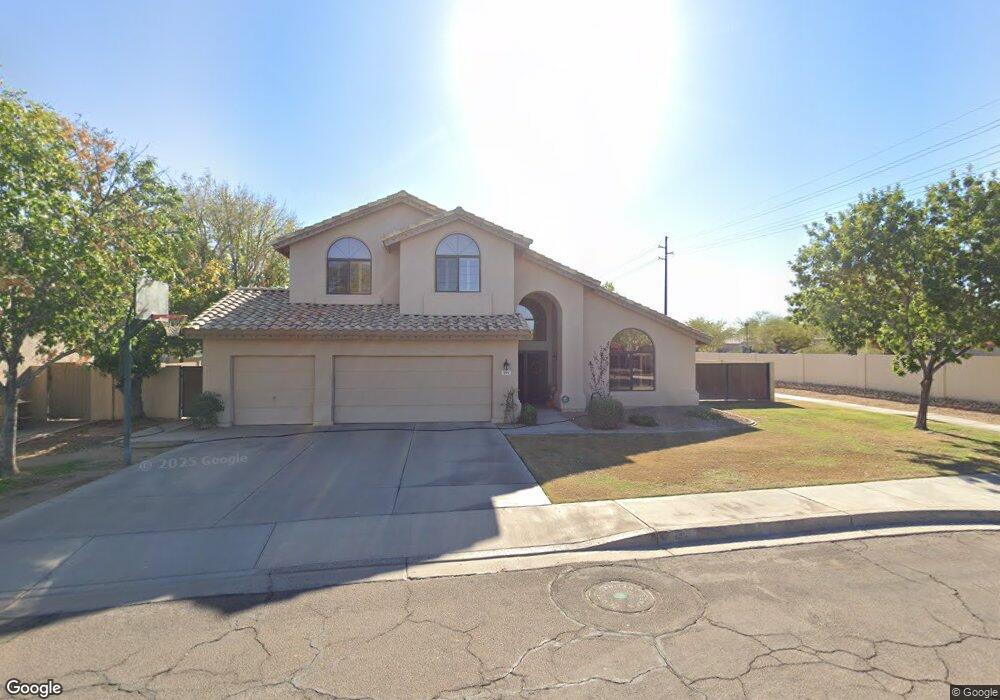
195 W Calle de Caballos Tempe, AZ 85284
South Tempe NeighborhoodEstimated Value: $619,981 - $769,000
--
Bed
3
Baths
2,570
Sq Ft
$280/Sq Ft
Est. Value
About This Home
This home is located at 195 W Calle de Caballos, Tempe, AZ 85284 and is currently estimated at $719,245, approximately $279 per square foot. 195 W Calle de Caballos is a home located in Maricopa County with nearby schools including C I Waggoner School, Kyrene Middle School, and Corona Del Sol High School.
Ownership History
Date
Name
Owned For
Owner Type
Purchase Details
Closed on
Mar 2, 1999
Sold by
Semenza Curtis R
Bought by
Hanenburg Jason L and Hanenburg Terry L
Current Estimated Value
Home Financials for this Owner
Home Financials are based on the most recent Mortgage that was taken out on this home.
Original Mortgage
$181,280
Outstanding Balance
$43,799
Interest Rate
6.73%
Mortgage Type
New Conventional
Estimated Equity
$675,446
Purchase Details
Closed on
Nov 23, 1998
Sold by
So Frank F and Tang Molly S
Bought by
Semenza Curtis R
Home Financials for this Owner
Home Financials are based on the most recent Mortgage that was taken out on this home.
Original Mortgage
$191,900
Interest Rate
6.84%
Mortgage Type
New Conventional
Create a Home Valuation Report for This Property
The Home Valuation Report is an in-depth analysis detailing your home's value as well as a comparison with similar homes in the area
Home Values in the Area
Average Home Value in this Area
Purchase History
| Date | Buyer | Sale Price | Title Company |
|---|---|---|---|
| Hanenburg Jason L | $226,600 | Ati Title Agency | |
| Semenza Curtis R | $202,000 | Ati Title Agency |
Source: Public Records
Mortgage History
| Date | Status | Borrower | Loan Amount |
|---|---|---|---|
| Open | Hanenburg Jason L | $181,280 | |
| Previous Owner | Semenza Curtis R | $191,900 |
Source: Public Records
Tax History Compared to Growth
Tax History
| Year | Tax Paid | Tax Assessment Tax Assessment Total Assessment is a certain percentage of the fair market value that is determined by local assessors to be the total taxable value of land and additions on the property. | Land | Improvement |
|---|---|---|---|---|
| 2025 | $3,724 | $39,659 | -- | -- |
| 2024 | $3,494 | $37,771 | -- | -- |
| 2023 | $3,494 | $49,980 | $9,990 | $39,990 |
| 2022 | $3,313 | $37,830 | $7,560 | $30,270 |
| 2021 | $3,442 | $35,810 | $7,160 | $28,650 |
| 2020 | $3,360 | $34,300 | $6,860 | $27,440 |
| 2019 | $3,254 | $33,070 | $6,610 | $26,460 |
| 2018 | $3,145 | $31,450 | $6,290 | $25,160 |
| 2017 | $3,015 | $29,870 | $5,970 | $23,900 |
| 2016 | $3,057 | $30,600 | $6,120 | $24,480 |
| 2015 | $2,824 | $27,770 | $5,550 | $22,220 |
Source: Public Records
Map
Nearby Homes
- 269 W El Freda Rd
- 155 W Palomino Dr
- 8438 S Maple Ave
- 8382 S Mill Ave
- 386 W Pecan Place
- 8578 S Maple Ave
- 62 W Secretariat Dr
- 8272 S Pecan Grove Cir
- 8276 S Pecan Grove Cir
- 8336 S Homestead Ln
- 437 W Verde Ln
- 91 W Calle de Arcos
- 39 W Vinedo Ln
- 7854 S Dateland Dr
- 9011 S Dateland Dr
- 11812 S 71st St
- 260 E Rhea Rd
- 42 W La Vieve Ln
- 7026 E Warner Rd
- 8938 S Forest Ave
- 175 W Calle de Caballos
- 186 W El Freda Rd
- 178 W El Freda Rd
- 170 W El Freda Rd
- 165 W Calle de Caballos
- 190 W Calle de Caballos
- 182 W Calle de Caballos
- 154 W El Freda Rd
- 155 W Calle de Caballos
- 259 W Calle de Caballos
- 248 W Calle de Caballos
- 174 W Calle de Caballos
- 146 E El Freda Cir
- 146 W El Freda Rd
- 173 W El Freda Rd
- 189 W Pecan Place
- 258 W El Freda Rd
- 163 W El Freda Rd
- 145 W Calle de Caballos
- 173 W Pecan Place