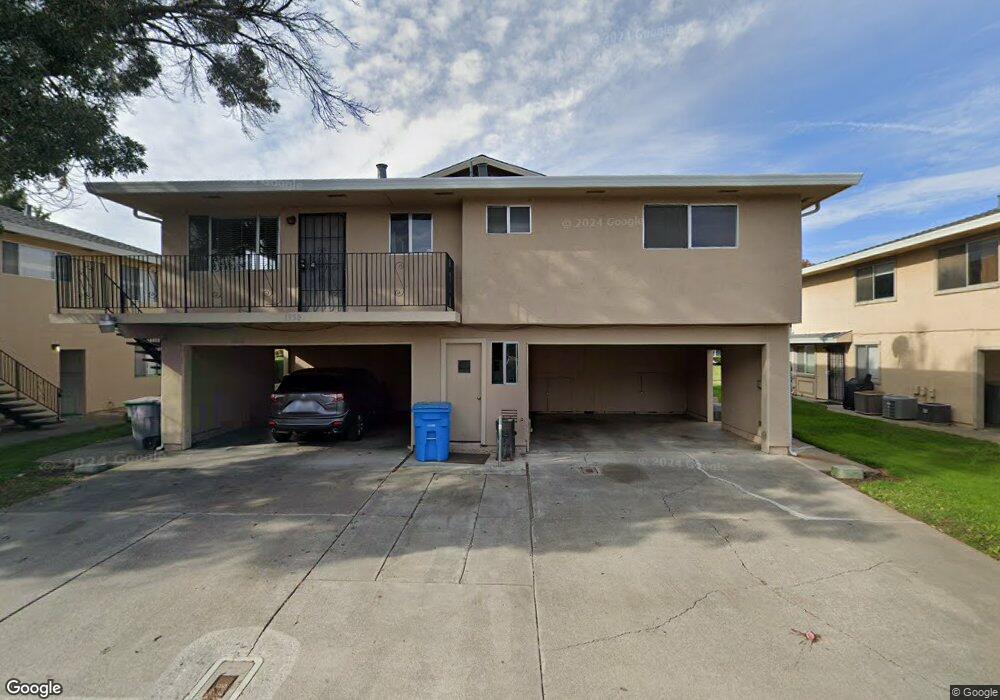
1950 Duxburry Ln Unit 3 Vacaville, CA 95687
Estimated Value: $240,000 - $259,000
2
Beds
1
Bath
882
Sq Ft
$283/Sq Ft
Est. Value
About This Home
This home is located at 1950 Duxburry Ln Unit 3, Vacaville, CA 95687 and is currently estimated at $249,615, approximately $283 per square foot. 1950 Duxburry Ln Unit 3 is a home located in Solano County with nearby schools including Eugene Padan Elementary School, Orchard Elementary School, and Vaca Pena Middle School.
Ownership History
Date
Name
Owned For
Owner Type
Purchase Details
Closed on
Feb 23, 2024
Sold by
Christison Dayle and Christison Paula
Bought by
Ledoux-Christison Family Trust and Christison
Current Estimated Value
Purchase Details
Closed on
Jun 16, 2010
Sold by
Barron Jeffery R
Bought by
Ledoux Christison Paula and Christison Dayle
Purchase Details
Closed on
Aug 1, 2001
Sold by
Lee Ken
Bought by
Barron Jeffery R
Home Financials for this Owner
Home Financials are based on the most recent Mortgage that was taken out on this home.
Original Mortgage
$90,250
Interest Rate
7.09%
Purchase Details
Closed on
Feb 22, 2001
Sold by
Grskovic Zdanko and Grskovic Marcia
Bought by
Lee Ken
Home Financials for this Owner
Home Financials are based on the most recent Mortgage that was taken out on this home.
Original Mortgage
$58,500
Interest Rate
6.89%
Create a Home Valuation Report for This Property
The Home Valuation Report is an in-depth analysis detailing your home's value as well as a comparison with similar homes in the area
Home Values in the Area
Average Home Value in this Area
Purchase History
| Date | Buyer | Sale Price | Title Company |
|---|---|---|---|
| Ledoux-Christison Family Trust | -- | None Listed On Document | |
| Ledoux Christison Paula | $40,000 | Placer Title Company | |
| Barron Jeffery R | $95,000 | North American Title Co | |
| Lee Ken | $65,000 | North American Title Co |
Source: Public Records
Mortgage History
| Date | Status | Borrower | Loan Amount |
|---|---|---|---|
| Previous Owner | Barron Jeffery R | $90,250 | |
| Previous Owner | Lee Ken | $58,500 |
Source: Public Records
Tax History Compared to Growth
Tax History
| Year | Tax Paid | Tax Assessment Tax Assessment Total Assessment is a certain percentage of the fair market value that is determined by local assessors to be the total taxable value of land and additions on the property. | Land | Improvement |
|---|---|---|---|---|
| 2025 | $680 | $51,236 | $19,213 | $32,023 |
| 2024 | $680 | $50,233 | $18,837 | $31,396 |
| 2023 | $663 | $49,249 | $18,468 | $30,781 |
| 2022 | $646 | $48,284 | $18,106 | $30,178 |
| 2021 | $645 | $47,338 | $17,751 | $29,587 |
| 2020 | $635 | $46,853 | $17,569 | $29,284 |
| 2019 | $624 | $45,935 | $17,225 | $28,710 |
| 2018 | $616 | $45,036 | $16,888 | $28,148 |
| 2017 | $596 | $44,154 | $16,557 | $27,597 |
| 2016 | $581 | $43,289 | $16,233 | $27,056 |
| 2015 | $573 | $42,640 | $15,990 | $26,650 |
| 2014 | $539 | $41,805 | $15,677 | $26,128 |
Source: Public Records
Map
Nearby Homes
- 1950 Duxburry Ln Unit 2
- 1951 Aletha Ln Unit 4
- 1930 Duxburry Ln Unit 2
- 1970 Peabody Rd Unit 1
- 1967 Southwood Dr Unit 2
- 1878 Southwood Dr
- 2001 Eastwood Dr Unit 38
- 571 Greenwood Dr
- 500 Gregory Dr
- 137 Valhalla Ct
- 1597 Alamo Dr #141 Dr
- 466 Bowline Dr
- 1607 California Dr
- 1597 Alamo Dr Unit 150
- 1597 Alamo Dr Unit 140
- 1597 Alamo Dr Unit 146
- 1597 Alamo Dr Unit 128
- 1597 Alamo Dr Unit 175
- 165 Audrey Place
- 196 Caldwell Dr
- 1950 Duxburry Ln Unit 4
- 1950 Duxburry Ln Unit 1
- 1940 Duxburry Ln Unit 4
- 1940 Duxburry Ln Unit 2
- 1940 Duxburry Ln Unit 3
- 1940 Duxburry Ln Unit 1
- 1960 Duxburry Ln Unit 3
- 1960 Duxburry Ln Unit 4
- 1960 Duxburry Ln Unit 2
- 1960 Duxburry Ln
- 1960 Duxburry Ln Unit 1
- 1951 Aletha Ln Unit 3
- 1951 Aletha Ln
- 1951 Aletha Ln Unit 2
- 1951 Aletha Ln
- 1951 Aletha Ln Unit 1
- 1930 Duxburry Ln
- 1930 Duxburry Ln Unit 4
- 1930 Duxburry Ln Unit 3
- 1930 Duxburry Ln Unit 3