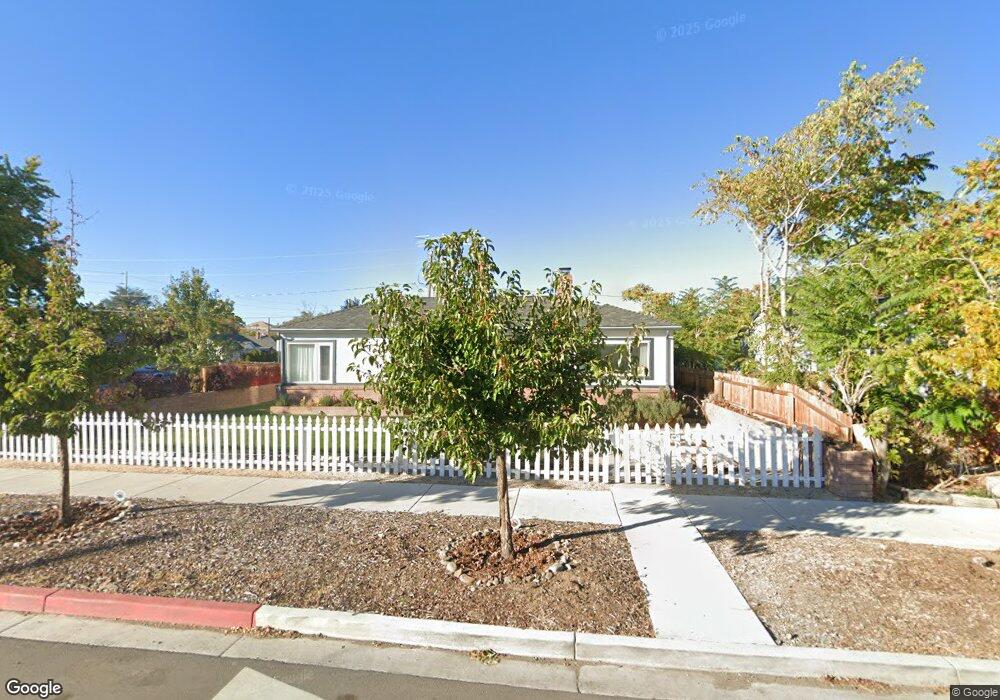
1950 F St Unit 1 Sparks, NV 89431
Downtown Sparks NeighborhoodEstimated Value: $405,000 - $419,000
3
Beds
2
Baths
1,524
Sq Ft
$270/Sq Ft
Est. Value
About This Home
This home is located at 1950 F St Unit 1, Sparks, NV 89431 and is currently estimated at $412,048, approximately $270 per square foot. 1950 F St Unit 1 is a home located in Washoe County with nearby schools including Kate M Smith Elementary School, Sparks Middle School, and Sparks High School.
Ownership History
Date
Name
Owned For
Owner Type
Purchase Details
Closed on
Nov 19, 2014
Sold by
Ryan Corey D
Bought by
Mcgraw James F
Current Estimated Value
Home Financials for this Owner
Home Financials are based on the most recent Mortgage that was taken out on this home.
Original Mortgage
$171,950
Outstanding Balance
$132,204
Interest Rate
4.1%
Mortgage Type
New Conventional
Estimated Equity
$279,844
Purchase Details
Closed on
Oct 14, 2009
Sold by
Deutsche Bank National Trust Company
Bought by
Ryan Corey D
Home Financials for this Owner
Home Financials are based on the most recent Mortgage that was taken out on this home.
Original Mortgage
$114,163
Interest Rate
5.02%
Mortgage Type
FHA
Purchase Details
Closed on
Aug 4, 2009
Sold by
Willingham Nicholas J and Willingham Stephanie
Bought by
Deutsche Bank National Trust Company
Purchase Details
Closed on
May 24, 2004
Sold by
Brown Roger Dean
Bought by
Willingham Nicholas J and Willingham Stephanie
Home Financials for this Owner
Home Financials are based on the most recent Mortgage that was taken out on this home.
Original Mortgage
$223,300
Interest Rate
5.92%
Mortgage Type
FHA
Create a Home Valuation Report for This Property
The Home Valuation Report is an in-depth analysis detailing your home's value as well as a comparison with similar homes in the area
Home Values in the Area
Average Home Value in this Area
Purchase History
| Date | Buyer | Sale Price | Title Company |
|---|---|---|---|
| Mcgraw James F | $181,000 | Ticor Title | |
| Ryan Corey D | $130,000 | Northern Nevada Title Cc | |
| Deutsche Bank National Trust Company | $140,000 | Lsi Title Agency Inc | |
| Willingham Nicholas J | $230,000 | First Centennial Title Co |
Source: Public Records
Mortgage History
| Date | Status | Borrower | Loan Amount |
|---|---|---|---|
| Open | Mcgraw James F | $171,950 | |
| Previous Owner | Ryan Corey D | $114,163 | |
| Previous Owner | Willingham Nicholas J | $223,300 |
Source: Public Records
Tax History Compared to Growth
Tax History
| Year | Tax Paid | Tax Assessment Tax Assessment Total Assessment is a certain percentage of the fair market value that is determined by local assessors to be the total taxable value of land and additions on the property. | Land | Improvement |
|---|---|---|---|---|
| 2025 | $1,021 | $58,810 | $31,675 | $27,136 |
| 2024 | $1,021 | $54,676 | $27,860 | $26,816 |
| 2023 | $992 | $55,286 | $30,625 | $24,661 |
| 2022 | $965 | $42,667 | $22,680 | $19,987 |
| 2021 | $896 | $35,831 | $16,275 | $19,556 |
| 2020 | $840 | $35,070 | $15,820 | $19,250 |
| 2019 | $799 | $31,961 | $13,615 | $18,346 |
| 2018 | $763 | $27,804 | $10,220 | $17,584 |
| 2017 | $718 | $26,444 | $9,555 | $16,889 |
| 2016 | $700 | $24,226 | $7,420 | $16,806 |
| 2015 | $363 | $22,349 | $5,775 | $16,574 |
| 2014 | $1,686 | $19,545 | $3,815 | $15,730 |
| 2013 | -- | $17,927 | $2,730 | $15,197 |
Source: Public Records
Map
Nearby Homes
- 2136 Roundhouse Rd
- 1830 C St
- 2168 Cannonball Rd
- 1720 G St
- 1756 I St
- 2380 Roundhouse Rd
- 2335 Roundhouse Rd
- 234 18th St
- 848 Rock Blvd
- 2385 Pauline Ave
- 1889 Merchant St
- 1841 Merchant St
- 973 Damon Ln
- 1560 Steven Ct Unit 2
- 1855 Verano Dr
- 1536 Irene Way
- 1527 Steven Ct
- 1780 Greenbrae Dr
- 1010 12th St
- 1365 Prospect Ave