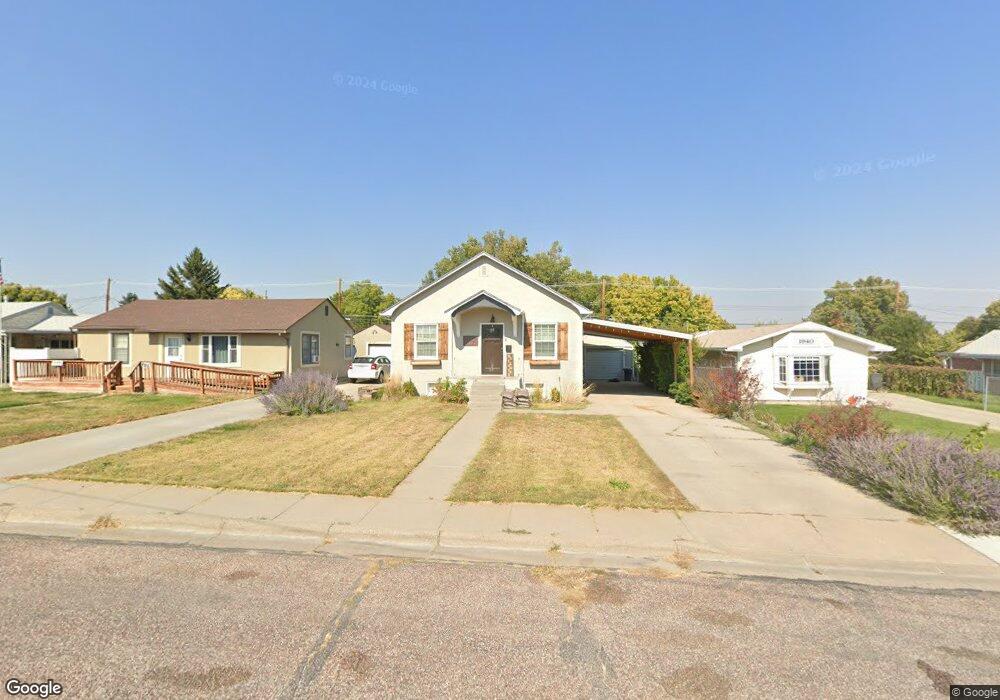
1950 O St Gering, NE 69341
Estimated Value: $176,000 - $209,000
2
Beds
1
Bath
1,052
Sq Ft
$182/Sq Ft
Est. Value
About This Home
This home is located at 1950 O St, Gering, NE 69341 and is currently estimated at $191,762, approximately $182 per square foot. 1950 O St is a home located in Scotts Bluff County with nearby schools including Gering High School and Community Christian Elementary/Middle School.
Ownership History
Date
Name
Owned For
Owner Type
Purchase Details
Closed on
Nov 18, 2013
Sold by
Kearns Keelie and Dike Duane
Bought by
Villafranca Isaac
Current Estimated Value
Home Financials for this Owner
Home Financials are based on the most recent Mortgage that was taken out on this home.
Original Mortgage
$124,753
Outstanding Balance
$93,256
Interest Rate
4.29%
Mortgage Type
New Conventional
Estimated Equity
$98,506
Purchase Details
Closed on
Aug 2, 2005
Sold by
Commercial Federal Bank
Bought by
Watson Ken and Watson Liana
Home Financials for this Owner
Home Financials are based on the most recent Mortgage that was taken out on this home.
Original Mortgage
$69,000
Interest Rate
7.95%
Mortgage Type
Future Advance Clause Open End Mortgage
Purchase Details
Closed on
Feb 23, 2005
Sold by
Warburton Daniel J and Warburton Amanda L
Bought by
Commercial Federal Bank
Create a Home Valuation Report for This Property
The Home Valuation Report is an in-depth analysis detailing your home's value as well as a comparison with similar homes in the area
Home Values in the Area
Average Home Value in this Area
Purchase History
| Date | Buyer | Sale Price | Title Company |
|---|---|---|---|
| Villafranca Isaac | $122,000 | None Available | |
| Watson Ken | $69,000 | -- | |
| Commercial Federal Bank | $89,030 | -- |
Source: Public Records
Mortgage History
| Date | Status | Borrower | Loan Amount |
|---|---|---|---|
| Open | Villafranca Isaac | $124,753 | |
| Previous Owner | Watson Ken | $69,000 |
Source: Public Records
Tax History Compared to Growth
Tax History
| Year | Tax Paid | Tax Assessment Tax Assessment Total Assessment is a certain percentage of the fair market value that is determined by local assessors to be the total taxable value of land and additions on the property. | Land | Improvement |
|---|---|---|---|---|
| 2024 | $2,677 | $153,860 | $17,500 | $136,360 |
| 2023 | $2,570 | $119,917 | $9,100 | $110,817 |
| 2022 | $2,570 | $119,917 | $9,100 | $110,817 |
| 2021 | $2,441 | $112,667 | $9,100 | $103,567 |
| 2020 | $2,348 | $107,735 | $9,100 | $98,635 |
| 2019 | $2,291 | $107,735 | $9,100 | $98,635 |
| 2018 | $2,305 | $107,735 | $9,100 | $98,635 |
| 2017 | $2,227 | $103,941 | $9,100 | $94,841 |
| 2016 | $2,067 | $103,941 | $9,100 | $94,841 |
| 2015 | $2,005 | $101,179 | $9,100 | $92,079 |
| 2014 | $1,897 | $94,358 | $9,100 | $85,258 |
| 2012 | -- | $92,686 | $9,100 | $83,586 |
Source: Public Records
Map
Nearby Homes