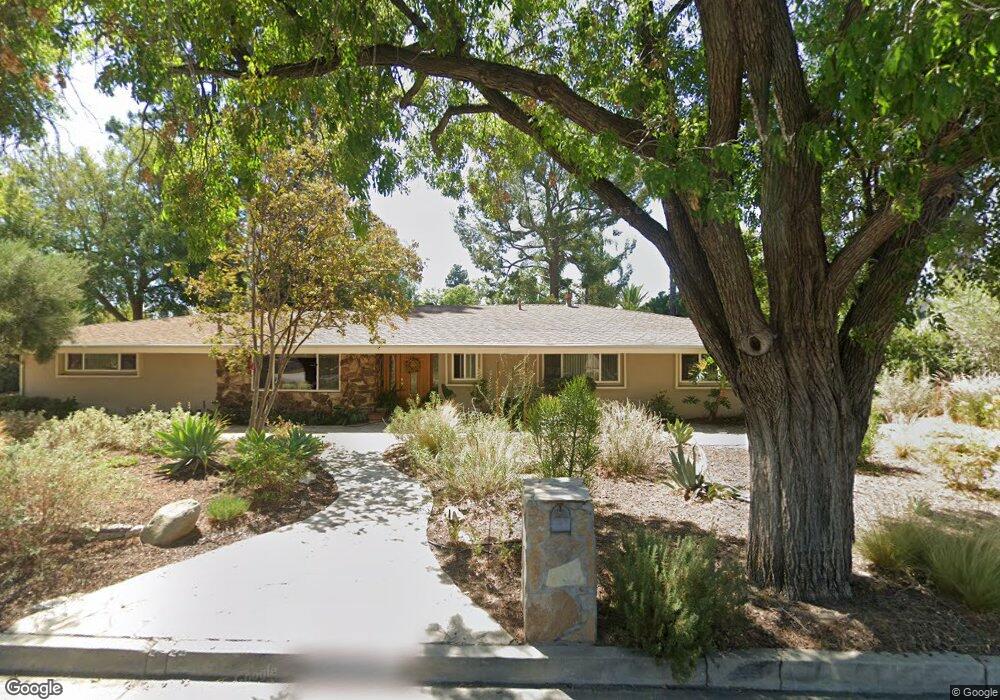
19500 Lemarsh St Northridge, CA 91324
Estimated Value: $1,305,000 - $1,547,000
4
Beds
3
Baths
2,560
Sq Ft
$541/Sq Ft
Est. Value
About This Home
This home is located at 19500 Lemarsh St, Northridge, CA 91324 and is currently estimated at $1,384,963, approximately $541 per square foot. 19500 Lemarsh St is a home located in Los Angeles County with nearby schools including Topeka Charter School For Advanced Studies, Our Community School, and Superior Street Elementary School.
Ownership History
Date
Name
Owned For
Owner Type
Purchase Details
Closed on
Jun 7, 2017
Sold by
Reichman Randal and Reichman Eleanor
Bought by
Relchman Randal Lee and Relchman Eleanor
Current Estimated Value
Purchase Details
Closed on
Sep 10, 1998
Sold by
Sherwood Properties
Bought by
Reichman Randal and Reichman Eleanor
Home Financials for this Owner
Home Financials are based on the most recent Mortgage that was taken out on this home.
Original Mortgage
$240,000
Interest Rate
6.88%
Purchase Details
Closed on
Sep 5, 1995
Sold by
Mccarthy Susan
Bought by
Sherwood Properties
Home Financials for this Owner
Home Financials are based on the most recent Mortgage that was taken out on this home.
Original Mortgage
$149,000
Interest Rate
7.97%
Create a Home Valuation Report for This Property
The Home Valuation Report is an in-depth analysis detailing your home's value as well as a comparison with similar homes in the area
Home Values in the Area
Average Home Value in this Area
Purchase History
| Date | Buyer | Sale Price | Title Company |
|---|---|---|---|
| Relchman Randal Lee | -- | None Available | |
| Reichman Randal | $300,000 | Gateway Title Company | |
| Sherwood Properties | $212,500 | First American Title Co |
Source: Public Records
Mortgage History
| Date | Status | Borrower | Loan Amount |
|---|---|---|---|
| Previous Owner | Reichman Randal | $240,000 | |
| Previous Owner | Sherwood Properties | $149,000 |
Source: Public Records
Tax History
| Year | Tax Paid | Tax Assessment Tax Assessment Total Assessment is a certain percentage of the fair market value that is determined by local assessors to be the total taxable value of land and additions on the property. | Land | Improvement |
|---|---|---|---|---|
| 2025 | $7,022 | $559,090 | $309,141 | $249,949 |
| 2024 | $7,022 | $548,129 | $303,080 | $245,049 |
| 2023 | $6,892 | $537,383 | $297,138 | $240,245 |
| 2022 | $6,582 | $526,847 | $291,312 | $235,535 |
| 2021 | $6,492 | $516,517 | $285,600 | $230,917 |
| 2019 | $6,303 | $501,199 | $277,130 | $224,069 |
| 2018 | $6,197 | $491,373 | $271,697 | $219,676 |
| 2016 | $5,907 | $472,295 | $261,148 | $211,147 |
| 2015 | $5,823 | $465,202 | $257,226 | $207,976 |
| 2014 | $5,850 | $456,091 | $252,188 | $203,903 |
Source: Public Records
Map
Nearby Homes
- 19530 Tuba St
- 10132 Hadley Ave
- 10261 Calvin Ave
- 19510 Merridy St
- 19501 Vintage St
- 10425 Melvin Ave
- 9916 Bothwell Rd
- 9847 Bothwell Rd
- 9827 Sylvia Ave
- 10225 Donna Ave
- 19914 Vintage St
- 10565 Lubao Ave
- 9659 Calvin Ave
- 19532 Bermuda St
- 10621 Vanalden Ave
- 19500 Tribune St
- 10808 Des Moines Ave
- 9710 Lubao Ave
- 10811 Baile Ave
- 19361 Plummer St
- 19514 Lemarsh St
- 19501 Romar St
- 19448 Lemarsh St
- 19501 Lemarsh St
- 19451 Romar St
- 19515 Lemarsh St
- 19526 Lemarsh St
- 19449 Lemarsh St
- 19527 Romar St
- 19441 Romar St
- 19500 Tuba St
- 19434 Lemarsh St
- 19531 Lemarsh St
- 19500 Romar St
- 19520 Tuba St
- 19514 Romar St
- 19425 Lemarsh St
- 19538 Lemarsh St
- 10214 Tunney Ave
- 19452 Romar St
Your Personal Tour Guide
Ask me questions while you tour the home.