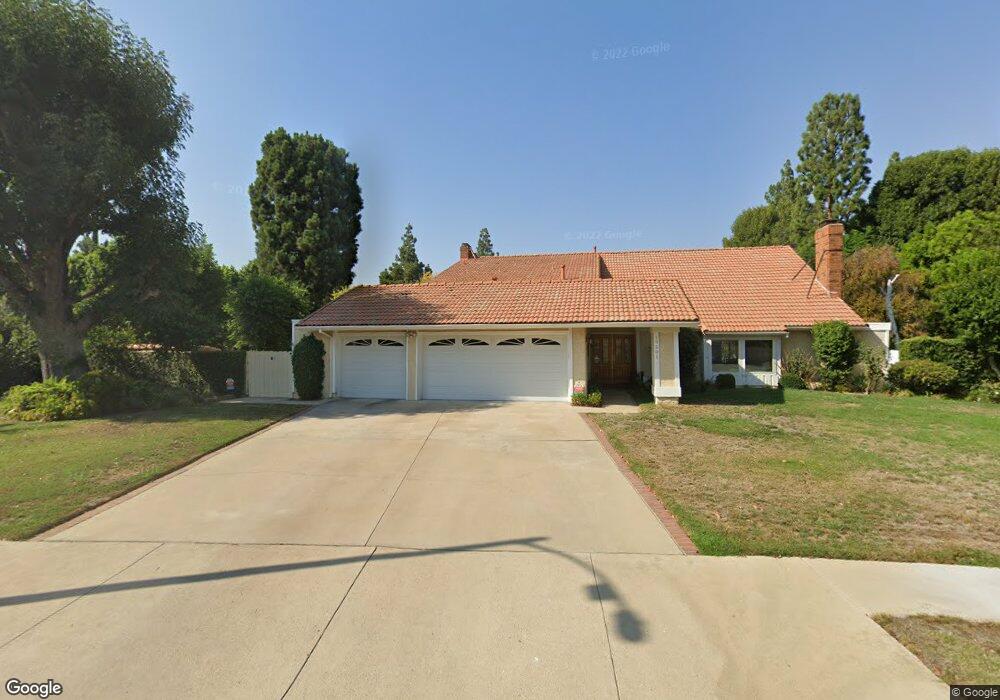
19501 Citronia St Northridge, CA 91324
Estimated Value: $1,598,440 - $1,846,000
4
Beds
4
Baths
3,369
Sq Ft
$504/Sq Ft
Est. Value
About This Home
This home is located at 19501 Citronia St, Northridge, CA 91324 and is currently estimated at $1,697,360, approximately $503 per square foot. 19501 Citronia St is a home located in Los Angeles County with nearby schools including Topeka Charter School For Advanced Studies, Our Community School, and Calahan Street Elementary.
Ownership History
Date
Name
Owned For
Owner Type
Purchase Details
Closed on
Apr 25, 2007
Sold by
Kourtjian Marcus C and Derr Norma K
Bought by
Kourtjian Marcus C and Derr Norma Kurkjian
Current Estimated Value
Purchase Details
Closed on
Aug 21, 2001
Sold by
Piszel Elizabeth M and Elizabeth M Piszel Trust
Bought by
Kourtjian Marcus C and Derr Norma K
Home Financials for this Owner
Home Financials are based on the most recent Mortgage that was taken out on this home.
Original Mortgage
$275,000
Outstanding Balance
$102,224
Interest Rate
6.5%
Estimated Equity
$1,595,136
Purchase Details
Closed on
Jul 15, 1996
Sold by
Piszel Elizabeth M
Bought by
Piszel Elizabeth M and Elizabeth M Piszel Trust
Purchase Details
Closed on
Nov 7, 1994
Sold by
Orkin Gary A and Orkin Tina D
Bought by
Piszel Elizabeth M
Create a Home Valuation Report for This Property
The Home Valuation Report is an in-depth analysis detailing your home's value as well as a comparison with similar homes in the area
Home Values in the Area
Average Home Value in this Area
Purchase History
| Date | Buyer | Sale Price | Title Company |
|---|---|---|---|
| Kourtjian Marcus C | -- | None Available | |
| Kourtjian Marcus C | $551,000 | California Title | |
| Piszel Elizabeth M | -- | -- | |
| Piszel Elizabeth M | $370,000 | Gateway Title |
Source: Public Records
Mortgage History
| Date | Status | Borrower | Loan Amount |
|---|---|---|---|
| Open | Kourtjian Marcus C | $275,000 |
Source: Public Records
Tax History Compared to Growth
Tax History
| Year | Tax Paid | Tax Assessment Tax Assessment Total Assessment is a certain percentage of the fair market value that is determined by local assessors to be the total taxable value of land and additions on the property. | Land | Improvement |
|---|---|---|---|---|
| 2025 | $10,177 | $813,971 | $457,215 | $356,756 |
| 2024 | $10,177 | $798,011 | $448,250 | $349,761 |
| 2023 | $9,987 | $782,364 | $439,461 | $342,903 |
| 2022 | $9,538 | $767,025 | $430,845 | $336,180 |
| 2021 | $9,410 | $751,987 | $422,398 | $329,589 |
| 2019 | $9,136 | $729,684 | $409,870 | $319,814 |
| 2018 | $8,977 | $715,378 | $401,834 | $313,544 |
| 2016 | $8,562 | $687,601 | $386,231 | $301,370 |
| 2015 | $8,440 | $677,274 | $380,430 | $296,844 |
| 2014 | $8,474 | $664,008 | $372,978 | $291,030 |
Source: Public Records
Map
Nearby Homes
- 19523 Ballinger St
- 19621 Citronia St
- 9701 Bothwell Rd
- 19651 Marilla St
- 9916 Bothwell Rd
- 19200 Ballinger St
- 9301 Shirley Ave Unit 70
- 19505 Cardigan Dr
- 9830 Oakdale Ave
- 9733 Kessler Ave
- 9514 Penfield Ave
- 19128 Prairie St
- 19530 Tuba St
- 20129 Halsted St
- 9251 Wystone Ave
- 18839 Plummer St
- 20124 Lassen St
- 19029 Nordhoff St Unit 103
- 19029 Nordhoff St Unit 308
- 19029 Nordhoff St Unit 108
- 19500 Superior St
- 19511 Citronia St
- 19451 Citronia St
- 19452 Superior St
- 19516 Superior St
- 19500 Citronia St
- 19462 Citronia St
- 19510 Citronia St
- 19523 Citronia St
- 19441 Citronia St
- 19520 Citronia St
- 19530 Superior St
- 19450 Citronia St
- 19501 Superior St
- 19515 Superior St
- 19533 Citronia St
- 19453 Superior St
- 9700 Belmar Ave
- 19457 Itasca St
- 19530 Citronia St