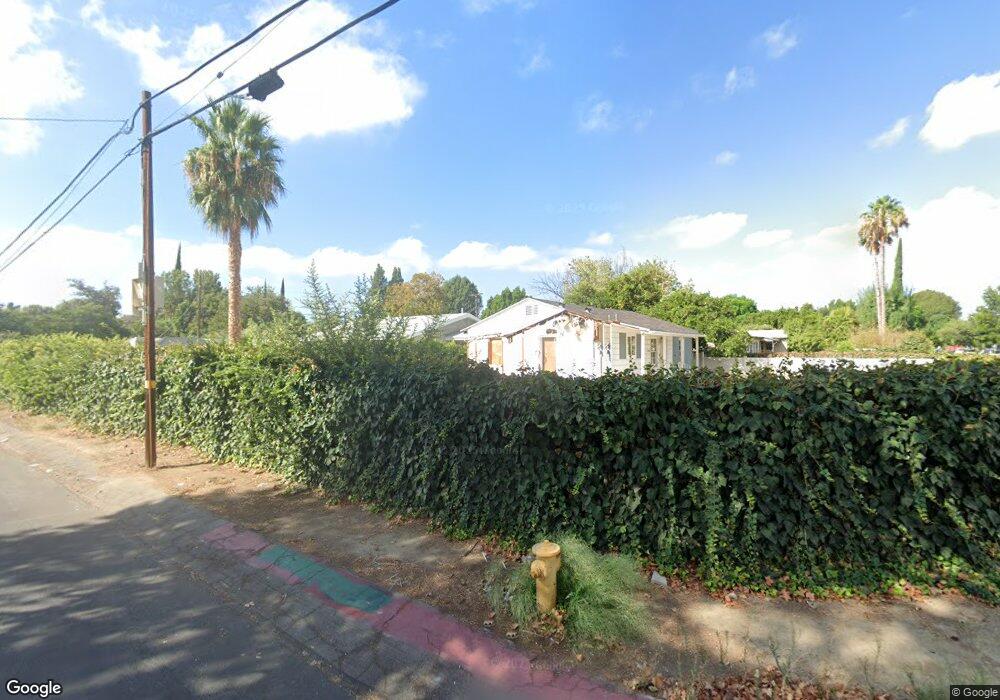
19502 Lanark St Unit ADU Reseda, CA 91335
Estimated Value: $889,000 - $1,190,000
1
Bed
1
Bath
560
Sq Ft
$1,870/Sq Ft
Est. Value
About This Home
This home is located at 19502 Lanark St Unit ADU, Reseda, CA 91335 and is currently estimated at $1,047,267, approximately $1,870 per square foot. 19502 Lanark St Unit ADU is a home located in Los Angeles County with nearby schools including Melvin Avenue Elementary School, John A. Sutter Middle School, and Northridge Academy High.
Ownership History
Date
Name
Owned For
Owner Type
Purchase Details
Closed on
Oct 26, 2016
Sold by
Iny Asaf
Bought by
Asi Rll Llc
Current Estimated Value
Purchase Details
Closed on
Nov 1, 2012
Sold by
Robbins Minnie Waln and The Robbins Family Trust
Bought by
Iny Asaf and Iny Soli
Home Financials for this Owner
Home Financials are based on the most recent Mortgage that was taken out on this home.
Original Mortgage
$273,000
Interest Rate
3.33%
Mortgage Type
New Conventional
Purchase Details
Closed on
Dec 12, 2005
Sold by
Robbins Gillie and Robbins Family Trust
Bought by
Robbins Gillie
Purchase Details
Closed on
Mar 26, 1997
Sold by
Trust Robbins Gillie Co Tr Robbins Famil and Robbins Minnie Waln
Bought by
Robbins Gillie and Gillie Robbins Family Trust
Create a Home Valuation Report for This Property
The Home Valuation Report is an in-depth analysis detailing your home's value as well as a comparison with similar homes in the area
Home Values in the Area
Average Home Value in this Area
Purchase History
| Date | Buyer | Sale Price | Title Company |
|---|---|---|---|
| Asi Rll Llc | -- | None Available | |
| Iny Asaf | $400,000 | Equity Title Los Angeles | |
| Robbins Gillie | -- | -- | |
| Robbins Gillie | -- | -- |
Source: Public Records
Mortgage History
| Date | Status | Borrower | Loan Amount |
|---|---|---|---|
| Previous Owner | Iny Asaf | $273,000 |
Source: Public Records
Tax History Compared to Growth
Tax History
| Year | Tax Paid | Tax Assessment Tax Assessment Total Assessment is a certain percentage of the fair market value that is determined by local assessors to be the total taxable value of land and additions on the property. | Land | Improvement |
|---|---|---|---|---|
| 2025 | $6,400 | $492,558 | $291,473 | $201,085 |
| 2024 | $6,400 | $482,901 | $285,758 | $197,143 |
| 2023 | $6,285 | $473,433 | $280,155 | $193,278 |
| 2022 | $6,010 | $464,151 | $274,662 | $189,489 |
| 2021 | $5,937 | $455,051 | $269,277 | $185,774 |
| 2019 | $5,772 | $441,556 | $261,291 | $180,265 |
| 2018 | $5,424 | $432,899 | $256,168 | $176,731 |
| 2016 | $5,180 | $416,091 | $246,222 | $169,869 |
| 2015 | $5,106 | $409,842 | $242,524 | $167,318 |
| 2014 | $5,135 | $401,815 | $237,774 | $164,041 |
Source: Public Records
Map
Nearby Homes
- 19516 Blythe St
- 19426 Blythe St
- 19709 Strathern St
- 8359 Melvin Ave
- 19222 Roscoe Blvd
- 19211 Strathern St
- 19331 Ingomar St
- 19158 Roscoe Blvd
- 8433 Melvin Ave
- 8450 Calvin Ave
- 19106 Cantara St
- 19144 Schoenborn St
- 8509 Shirley Ave
- 19910 Cantara St
- 8410 Beckford Ave
- 8529 Tunney Ave
- 19931 Lanark St
- 19935 Lanark St
- 8366 Oakdale Ave
- 19046 Schoenborn St
- 19502 Lanark St
- 19512 Lanark St
- 8124 Shirley Ave
- 8130 Shirley Ave
- 8118 Shirley Ave
- 19503 Lorne St
- 19522 Lanark St
- 19458 Lanark St
- 19513 Lorne St
- 8110 Shirley Ave
- 19503 Lanark St
- 19450 Lanark St
- 8140 Shirley Ave
- 19523 Lorne St
- 8104 Shirley Ave
- 19532 Lanark St
- 19444 Lanark St
- 19523 Lanark St
- 8150 Shirley Ave
- 19465 Lanark St