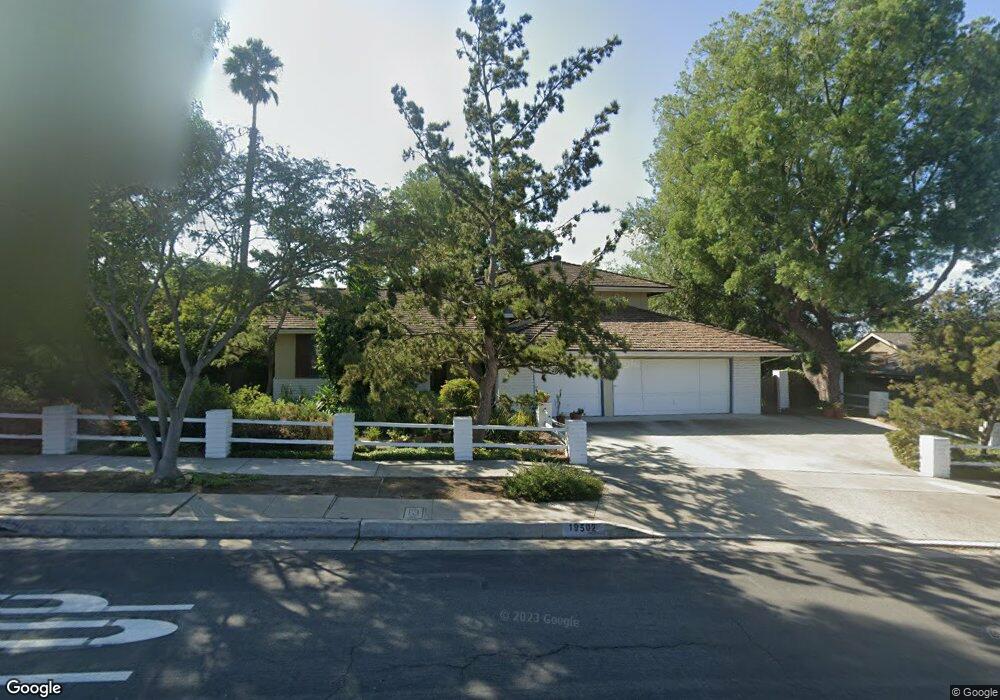
19502 Old Ranch Rd Yorba Linda, CA 92886
Estimated Value: $1,457,288 - $1,672,000
4
Beds
4
Baths
2,258
Sq Ft
$696/Sq Ft
Est. Value
About This Home
This home is located at 19502 Old Ranch Rd, Yorba Linda, CA 92886 and is currently estimated at $1,571,572, approximately $696 per square foot. 19502 Old Ranch Rd is a home located in Orange County with nearby schools including Fairmont Elementary, Bernardo Yorba Middle School, and Ivycrest Montessori Private School - Yorba Linda.
Create a Home Valuation Report for This Property
The Home Valuation Report is an in-depth analysis detailing your home's value as well as a comparison with similar homes in the area
Home Values in the Area
Average Home Value in this Area
Tax History Compared to Growth
Tax History
| Year | Tax Paid | Tax Assessment Tax Assessment Total Assessment is a certain percentage of the fair market value that is determined by local assessors to be the total taxable value of land and additions on the property. | Land | Improvement |
|---|---|---|---|---|
| 2025 | $4,997 | $436,707 | $250,421 | $186,286 |
| 2024 | $4,997 | $428,145 | $245,511 | $182,634 |
| 2023 | $4,901 | $419,750 | $240,697 | $179,053 |
| 2022 | $4,851 | $411,520 | $235,977 | $175,543 |
| 2021 | $4,761 | $403,451 | $231,350 | $172,101 |
| 2020 | $4,658 | $399,315 | $228,978 | $170,337 |
| 2019 | $4,496 | $391,486 | $224,488 | $166,998 |
| 2018 | $4,441 | $383,810 | $220,086 | $163,724 |
| 2017 | $4,368 | $376,285 | $215,771 | $160,514 |
| 2016 | $4,280 | $368,907 | $211,540 | $157,367 |
| 2015 | $4,226 | $363,366 | $208,362 | $155,004 |
| 2014 | $4,101 | $356,249 | $204,281 | $151,968 |
Source: Public Records
Map
Nearby Homes
- 19762 Ridgewood Place
- 19862 Le Mans Cir
- 5031 Fairway View Dr
- 5371 Grandview Ave
- 19701 Parkview Terrace
- 5245 Grandview Ave
- 19831 Caprice Dr
- 5335 Grandview Ave
- 18931 Gordon Ln
- 5754 Kellogg Dr
- 5861 Sunmist Dr
- 4774 Serrente Plaza
- 4741 Cardena Plaza
- 19841 Lombardy Ln
- 19072 Lamplight Ln
- 5540 Via Sara
- 6025 Kingsbriar Dr
- 91 VAC/COR E Avenue L
- 5729 Grandview Ave
- 20361 Via Juana
- 19482 Old Ranch Rd
- 19522 Old Ranch Rd
- 19511 Old Ranch Rd
- 19491 Old Ranch Rd
- 19462 Old Ranch Rd
- 19542 Old Ranch Rd
- 19531 Old Ranch Rd
- 5342 Broken Hill Ct
- 19442 Old Ranch Rd
- 19551 Old Ranch Rd
- 19562 Old Ranch Rd
- 5332 Broken Hill Ct
- 5292 Broken Hill Ct
- 5351 Broken Hill Ct
- 5282 Broken Hill Ct
- 5312 Broken Hill Ct
- 5311 Pasatiempo Dr
- 19412 Old Ranch Rd
- 19582 Old Ranch Rd
- 5341 Broken Hill Ct