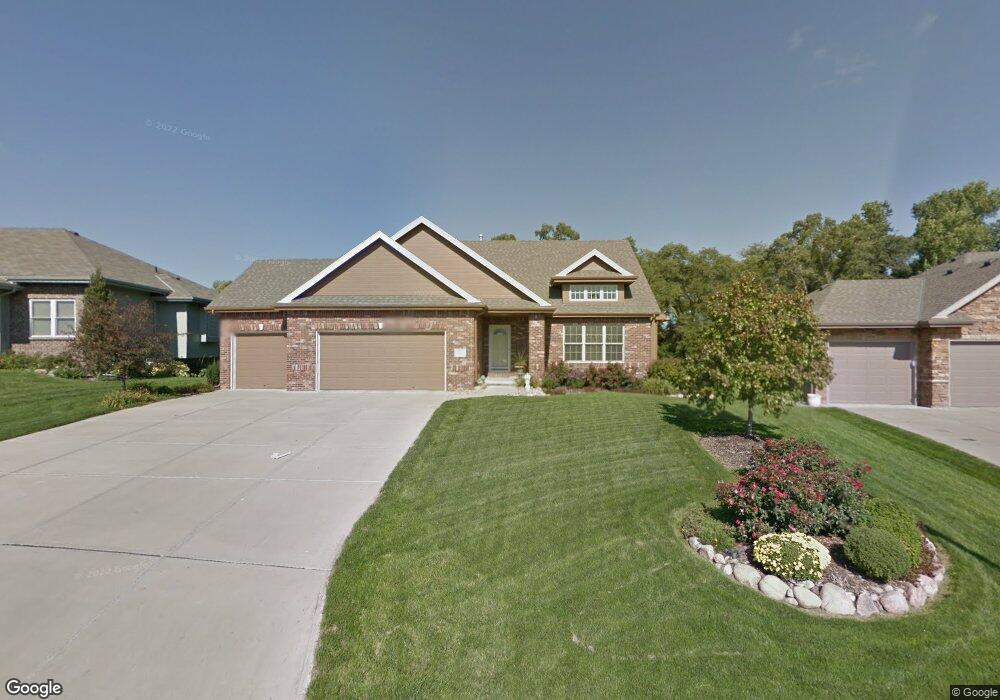
19508 Josephine St Gretna, NE 68028
Estimated Value: $502,000 - $566,000
4
Beds
5
Baths
1,991
Sq Ft
$270/Sq Ft
Est. Value
About This Home
This home is located at 19508 Josephine St, Gretna, NE 68028 and is currently estimated at $537,128, approximately $269 per square foot. 19508 Josephine St is a home located in Sarpy County with nearby schools including Reeder Elementary School, Beadle Middle School, and Millard West High School.
Ownership History
Date
Name
Owned For
Owner Type
Purchase Details
Closed on
Mar 7, 2025
Sold by
Vcelik Michael T and Vcelik Judy A
Bought by
Vcelik Living Trust and Vcelik
Current Estimated Value
Purchase Details
Closed on
May 25, 2006
Sold by
Todd Menard Construction Llc
Bought by
Vcelik Michael T and Vcelik Judy A
Home Financials for this Owner
Home Financials are based on the most recent Mortgage that was taken out on this home.
Original Mortgage
$268,000
Interest Rate
6.56%
Purchase Details
Closed on
Dec 16, 2005
Sold by
Osborn Douglas M and Osborn Gloria S
Bought by
Todd Menard Construction Llc
Home Financials for this Owner
Home Financials are based on the most recent Mortgage that was taken out on this home.
Original Mortgage
$280,000
Interest Rate
6.3%
Mortgage Type
Small Business Administration
Create a Home Valuation Report for This Property
The Home Valuation Report is an in-depth analysis detailing your home's value as well as a comparison with similar homes in the area
Home Values in the Area
Average Home Value in this Area
Purchase History
| Date | Buyer | Sale Price | Title Company |
|---|---|---|---|
| Vcelik Living Trust | -- | None Listed On Document | |
| Vcelik Michael T | $366,000 | None Available | |
| Todd Menard Construction Llc | -- | -- | |
| Osborn Douglas M | -- | -- |
Source: Public Records
Mortgage History
| Date | Status | Borrower | Loan Amount |
|---|---|---|---|
| Previous Owner | Vcelik Michael T | $268,000 | |
| Previous Owner | Todd Menard Construction Llc | $280,000 |
Source: Public Records
Tax History Compared to Growth
Tax History
| Year | Tax Paid | Tax Assessment Tax Assessment Total Assessment is a certain percentage of the fair market value that is determined by local assessors to be the total taxable value of land and additions on the property. | Land | Improvement |
|---|---|---|---|---|
| 2025 | $8,412 | $528,105 | $88,000 | $440,105 |
| 2024 | $9,244 | $510,730 | $88,000 | $422,730 |
| 2023 | $9,244 | $461,482 | $75,000 | $386,482 |
| 2022 | $9,061 | $420,007 | $70,000 | $350,007 |
| 2021 | $8,537 | $391,385 | $68,500 | $322,885 |
| 2020 | $8,656 | $387,064 | $68,500 | $318,564 |
| 2019 | $8,218 | $366,727 | $68,500 | $298,227 |
| 2018 | $8,494 | $365,483 | $59,000 | $306,483 |
| 2017 | $8,520 | $359,389 | $59,000 | $300,389 |
| 2016 | $8,510 | $356,896 | $57,000 | $299,896 |
| 2015 | $8,697 | $353,971 | $57,000 | $296,971 |
| 2014 | $8,810 | $343,701 | $57,000 | $286,701 |
| 2012 | -- | $330,542 | $53,000 | $277,542 |
Source: Public Records
Map
Nearby Homes
- 19603 Brookside Ln
- 7112 S 193rd St
- 19654 Chandler St
- 19821 Emiline St
- 10416 S 191st St
- 10219 S 191st St
- 18921 Lillian St
- 19965 Polk St
- 7819 S 194th Ave
- 20003 Polk St
- 19920 Tyler St
- 4549 S 203rd St
- 4505 S 203rd St
- 4538 S 203rd St
- 4522 S 203rd St
- 19823 Bellbrook Blvd
- 19836 Adams St
- 6515 S 199th Ave
- 19969 Monroe St
- 20970 Polk St
- 19504 Josephine St
- 19512 Josephine St
- 19418 Josephine St
- 19516 Josephine St
- 19503 Josephine St
- 19507 Josephine St
- 19409 Josephine St
- 19414 Josephine St
- 19520 Josephine St
- 19511 Josephine St
- 19405 Josephine St
- 19410 Josephine St
- 19524 Josephine St
- 19509 Audrey St
- 19515 Josephine St
- 19613 Audrey St
- 19505 Audrey St
- 19406 Josephine St
- 19501 Audrey St
- 19617 Audrey St