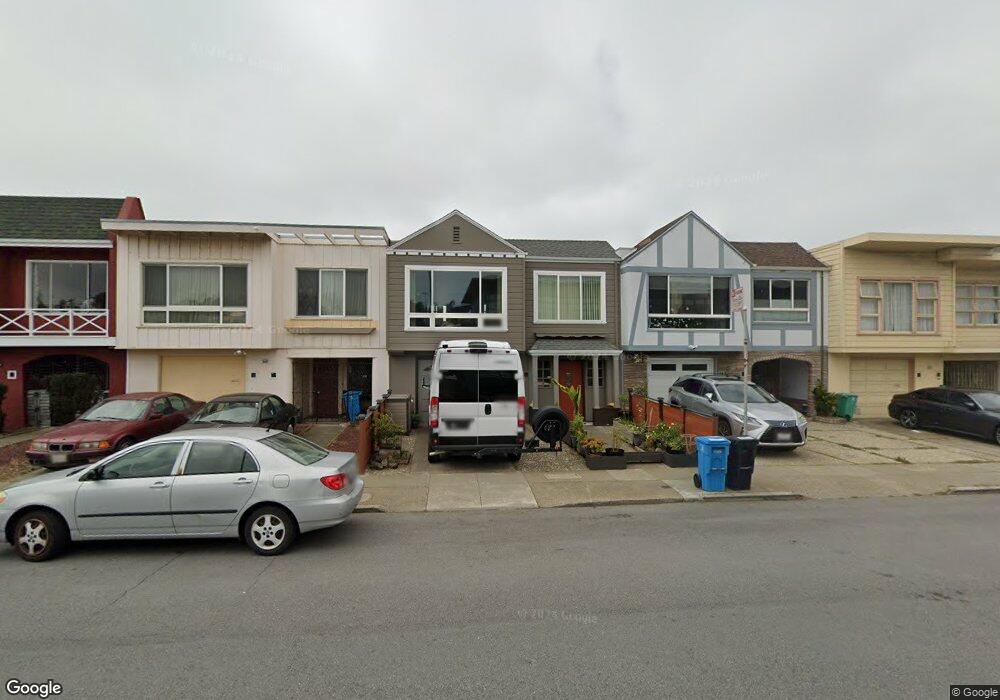
1951 41st Ave San Francisco, CA 94116
Outer Parkside NeighborhoodEstimated Value: $1,206,987 - $1,628,000
2
Beds
1
Bath
1,167
Sq Ft
$1,256/Sq Ft
Est. Value
About This Home
This home is located at 1951 41st Ave, San Francisco, CA 94116 and is currently estimated at $1,465,997, approximately $1,256 per square foot. 1951 41st Ave is a home located in San Francisco County with nearby schools including Sunset Elementary School, Giannini (A.P.) Middle School, and Holy Name Elementary School.
Ownership History
Date
Name
Owned For
Owner Type
Purchase Details
Closed on
Jun 7, 1999
Sold by
Ling Mak Shek Leung Chan Lai
Bought by
Kwong Jeaner Hui Yan
Current Estimated Value
Home Financials for this Owner
Home Financials are based on the most recent Mortgage that was taken out on this home.
Original Mortgage
$285,000
Outstanding Balance
$75,598
Interest Rate
7.12%
Estimated Equity
$1,390,399
Purchase Details
Closed on
Jan 5, 1996
Sold by
Marcos Helga H
Bought by
Mak Shek Leung and Chan Lai Ling
Home Financials for this Owner
Home Financials are based on the most recent Mortgage that was taken out on this home.
Original Mortgage
$169,800
Interest Rate
7.38%
Create a Home Valuation Report for This Property
The Home Valuation Report is an in-depth analysis detailing your home's value as well as a comparison with similar homes in the area
Home Values in the Area
Average Home Value in this Area
Purchase History
| Date | Buyer | Sale Price | Title Company |
|---|---|---|---|
| Kwong Jeaner Hui Yan | $380,000 | Fidelity National Title Co | |
| Mak Shek Leung | $226,500 | North American Title Co |
Source: Public Records
Mortgage History
| Date | Status | Borrower | Loan Amount |
|---|---|---|---|
| Open | Kwong Jeaner Hui Yan | $285,000 | |
| Previous Owner | Mak Shek Leung | $169,800 |
Source: Public Records
Tax History Compared to Growth
Tax History
| Year | Tax Paid | Tax Assessment Tax Assessment Total Assessment is a certain percentage of the fair market value that is determined by local assessors to be the total taxable value of land and additions on the property. | Land | Improvement |
|---|---|---|---|---|
| 2025 | $7,549 | $595,711 | $357,430 | $238,281 |
| 2024 | $7,549 | $584,031 | $350,422 | $233,609 |
| 2023 | $7,427 | $572,580 | $343,551 | $229,029 |
| 2022 | $7,273 | $561,354 | $336,815 | $224,539 |
| 2021 | $7,139 | $550,348 | $330,211 | $220,137 |
| 2020 | $7,184 | $544,706 | $326,826 | $217,880 |
| 2019 | $6,940 | $534,026 | $320,418 | $213,608 |
| 2018 | $6,706 | $523,556 | $314,136 | $209,420 |
| 2017 | $6,327 | $513,291 | $307,977 | $205,314 |
| 2016 | $6,204 | $503,228 | $301,939 | $201,289 |
| 2015 | $6,124 | $495,670 | $297,404 | $198,266 |
| 2014 | $5,963 | $485,962 | $291,579 | $194,383 |
Source: Public Records
Map
Nearby Homes