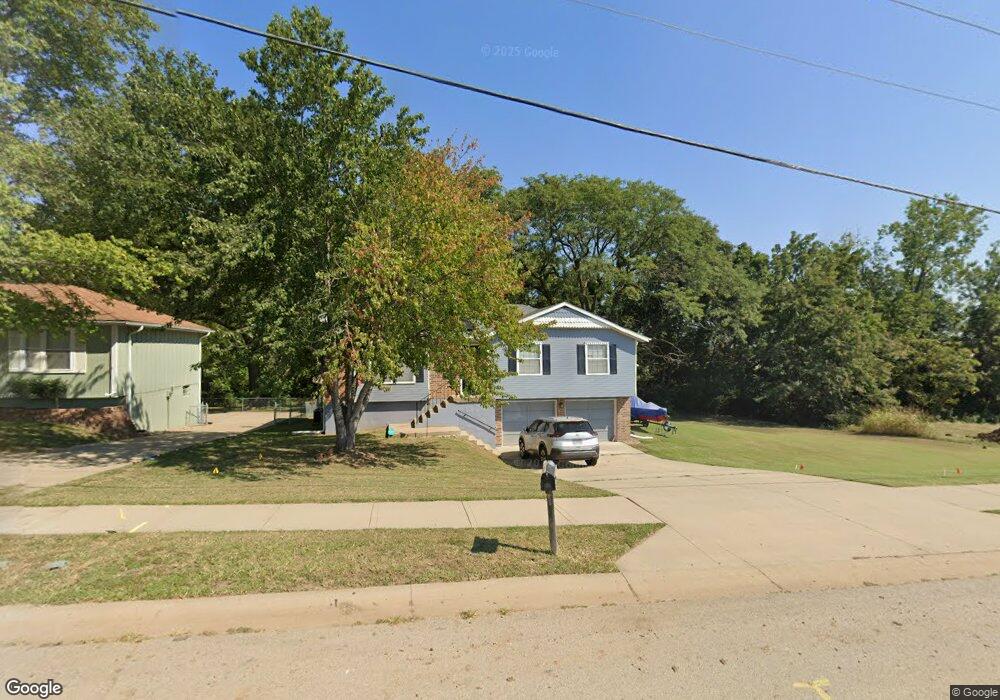
19512 E R D Mize Rd Independence, MO 64057
Blackburn NeighborhoodEstimated Value: $230,000 - $256,000
3
Beds
1
Bath
1,198
Sq Ft
$206/Sq Ft
Est. Value
About This Home
This home is located at 19512 E R D Mize Rd, Independence, MO 64057 and is currently estimated at $246,880, approximately $206 per square foot. 19512 E R D Mize Rd is a home located in Jackson County with nearby schools including LITTLE BLUE ELEM., Bridger Middle School, and Pioneer Ridge Middle School.
Ownership History
Date
Name
Owned For
Owner Type
Purchase Details
Closed on
Apr 22, 2024
Sold by
Defaith Veronica Y Chavez and Faith Veronica
Bought by
Faith Donald D and Faith Veronica Y
Current Estimated Value
Home Financials for this Owner
Home Financials are based on the most recent Mortgage that was taken out on this home.
Original Mortgage
$193,500
Outstanding Balance
$190,531
Interest Rate
6.74%
Mortgage Type
New Conventional
Estimated Equity
$56,349
Purchase Details
Closed on
Jun 5, 2007
Sold by
Green Josh and Green Megan
Bought by
Faith Veronica
Purchase Details
Closed on
Mar 28, 2006
Sold by
Higbee Joseph and Higbee Suzanne
Bought by
Green James J and Kincart Megan C
Home Financials for this Owner
Home Financials are based on the most recent Mortgage that was taken out on this home.
Original Mortgage
$125,210
Interest Rate
6.24%
Mortgage Type
FHA
Create a Home Valuation Report for This Property
The Home Valuation Report is an in-depth analysis detailing your home's value as well as a comparison with similar homes in the area
Home Values in the Area
Average Home Value in this Area
Purchase History
| Date | Buyer | Sale Price | Title Company |
|---|---|---|---|
| Faith Donald D | -- | Chesterfield Title | |
| Faith Donald D | -- | Chesterfield Title | |
| Faith Veronica | -- | Metro One Title | |
| Green James J | -- | Metro |
Source: Public Records
Mortgage History
| Date | Status | Borrower | Loan Amount |
|---|---|---|---|
| Open | Faith Donald D | $193,500 | |
| Closed | Faith Donald D | $193,500 | |
| Previous Owner | Green James J | $125,210 |
Source: Public Records
Tax History
| Year | Tax Paid | Tax Assessment Tax Assessment Total Assessment is a certain percentage of the fair market value that is determined by local assessors to be the total taxable value of land and additions on the property. | Land | Improvement |
|---|---|---|---|---|
| 2025 | $2,287 | $32,163 | $4,651 | $27,512 |
| 2024 | $2,287 | $33,009 | $3,061 | $29,948 |
| 2023 | $2,235 | $33,009 | $3,730 | $29,279 |
| 2022 | $1,796 | $24,320 | $3,148 | $21,172 |
| 2021 | $1,796 | $24,320 | $3,148 | $21,172 |
| 2020 | $1,731 | $22,777 | $3,148 | $19,629 |
| 2019 | $1,703 | $22,777 | $3,148 | $19,629 |
| 2018 | $1,553 | $19,823 | $2,740 | $17,083 |
| 2017 | $1,548 | $19,823 | $2,740 | $17,083 |
| 2016 | $1,548 | $19,570 | $3,327 | $16,243 |
| 2014 | $1,470 | $19,000 | $3,230 | $15,770 |
Source: Public Records
Map
Nearby Homes
- 2916 Sweet Briar Dr
- 2944 Iva Ct
- 18004 E 31st Terrace
- 3200 S Bryn Mawr Dr
- 3220 S Bryn Mawr Dr
- 2800 Mohican Ave
- 3011 Tepee Ave
- 2829 Trenchard Dr
- 2805 Castle Dr
- 18809 E 32nd Terrace Ct S
- 18608 E 26th Terrace S
- 3304 S Cochise Ave
- 19804 E 24th Terrace Ct S
- 18307 Hanthorne Dr
- 20012 E 24th Terrace Ct S
- 20117 E 24th Terrace S
- 18401 E 26th Street Ct S
- 2309 S Heartland Ct
- 2431 S Ponca Ave
- 20204 E 23rd Ter Ct S
- 19508 E R D Mize Rd
- 19504 E R D Mize Rd
- 3025 Iva Dr
- 3021 Iva Dr
- 3018 Sweet Briar Dr
- 3016 Sweet Briar Dr
- 3012 Sweet Briar Dr
- 3013 Iva Dr
- 3009 Iva Dr
- 3024 Iva Dr
- 3018 Iva Dr
- 3012 Iva Dr
- 3008 Sweet Briar Dr
- 3005 Iva Dr
- 3013 Sweet Briar Dr
- 3009 Sweet Briar Dr
- 3008 Iva Dr
- 3004 Sweet Briar Dr
- 19408 E R D Mize Rd
- 3005 Sweet Briar Dr
Your Personal Tour Guide
Ask me questions while you tour the home.