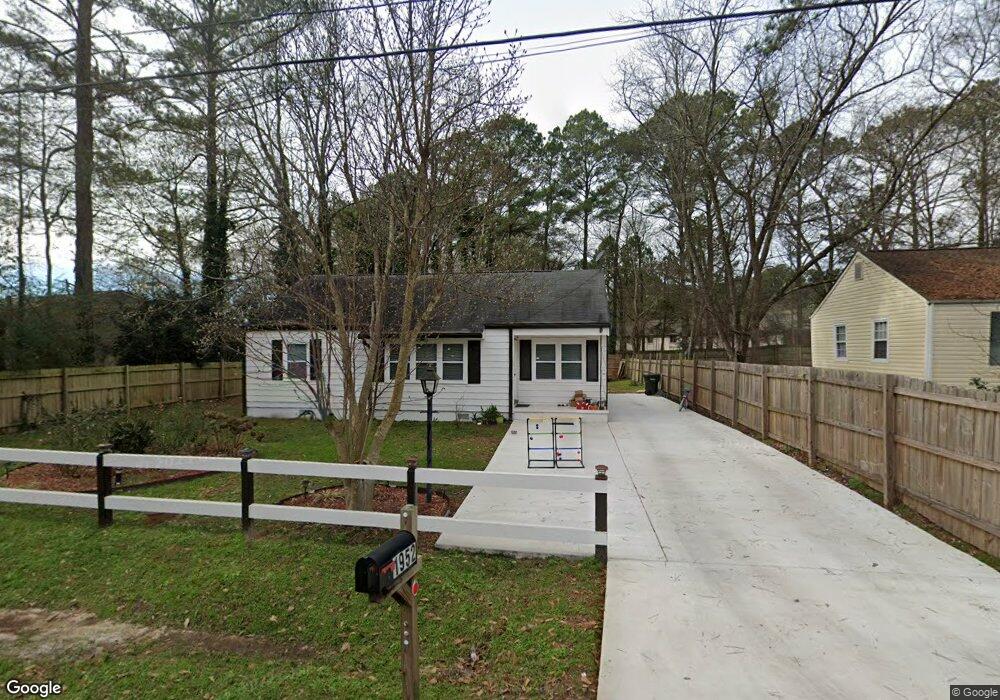
1952 Alexander St SE Unit 42 Smyrna, GA 30080
Estimated Value: $260,000 - $326,961
3
Beds
1
Bath
1,336
Sq Ft
$222/Sq Ft
Est. Value
About This Home
This home is located at 1952 Alexander St SE Unit 42, Smyrna, GA 30080 and is currently estimated at $296,740, approximately $222 per square foot. 1952 Alexander St SE Unit 42 is a home located in Cobb County with nearby schools including Green Acres Elementary School, Campbell High School, and International Academy of Smyrna.
Ownership History
Date
Name
Owned For
Owner Type
Purchase Details
Closed on
Sep 28, 2020
Sold by
Jensen Jeffrey C
Bought by
Jm & Kcl Enterprises Llc
Current Estimated Value
Home Financials for this Owner
Home Financials are based on the most recent Mortgage that was taken out on this home.
Original Mortgage
$129,150
Interest Rate
2.9%
Mortgage Type
New Conventional
Purchase Details
Closed on
Sep 29, 2017
Sold by
Lee Juanita
Bought by
Rosealetha Scott
Purchase Details
Closed on
Dec 22, 1993
Sold by
Secretary Of Hud
Bought by
Lee Juanita James C
Home Financials for this Owner
Home Financials are based on the most recent Mortgage that was taken out on this home.
Original Mortgage
$34,093
Interest Rate
7.13%
Mortgage Type
FHA
Purchase Details
Closed on
Jun 1, 1993
Sold by
Bank South Mtg Inc
Bought by
Secretary Of Hud
Create a Home Valuation Report for This Property
The Home Valuation Report is an in-depth analysis detailing your home's value as well as a comparison with similar homes in the area
Home Values in the Area
Average Home Value in this Area
Purchase History
| Date | Buyer | Sale Price | Title Company |
|---|---|---|---|
| Jm & Kcl Enterprises Llc | -- | None Available | |
| Jensen Jeffrey C | $184,500 | None Available | |
| Rosealetha Scott | $142,000 | -- | |
| Lee Juanita James C | -- | -- | |
| Secretary Of Hud | -- | -- | |
| Bank South Mtg Inc | $53,000 | -- |
Source: Public Records
Mortgage History
| Date | Status | Borrower | Loan Amount |
|---|---|---|---|
| Closed | Jensen Jeffrey C | $129,150 | |
| Previous Owner | Lee Juanita James C | $34,093 |
Source: Public Records
Tax History Compared to Growth
Tax History
| Year | Tax Paid | Tax Assessment Tax Assessment Total Assessment is a certain percentage of the fair market value that is determined by local assessors to be the total taxable value of land and additions on the property. | Land | Improvement |
|---|---|---|---|---|
| 2025 | $3,628 | $120,420 | $28,000 | $92,420 |
| 2024 | $3,631 | $120,420 | $28,000 | $92,420 |
| 2023 | $3,447 | $114,312 | $20,000 | $94,312 |
| 2022 | $2,875 | $94,740 | $20,000 | $74,740 |
| 2021 | $2,137 | $70,420 | $20,000 | $50,420 |
| 2020 | $1,128 | $50,316 | $20,000 | $30,316 |
| 2019 | $1,247 | $55,760 | $14,000 | $41,760 |
| 2018 | $1,247 | $55,760 | $14,000 | $41,760 |
| 2017 | $1,021 | $35,516 | $10,000 | $25,516 |
| 2016 | $783 | $27,232 | $5,600 | $21,632 |
| 2015 | $802 | $27,232 | $5,600 | $21,632 |
| 2014 | $809 | $27,232 | $0 | $0 |
Source: Public Records
Map
Nearby Homes
- 638 Medford Place SE
- 1948 Benson Ave SE
- 731 Mozley Dr SE
- 2039 Gober Ave SE
- 7004 Pat Mell Place SE
- 753 Taylor Dr SE
- 1670 Concord Dr SE
- 2046 Harold Ave SE
- 2185 Trailwood Dr SE
- 1858 Belmore St SE
- 690 Green Acres Rd SE
- 2275 Old Spring Rd SE
- 2145 Valley Oaks Dr SE
- 419 McInnes Cir
- 846 Mell Ct SE
- 2305 Ventura Rd SE
- 1952 Alexander St SE
- 1934 Alexander St SE
- 0 Alexander St SE Unit 8245849
- 0 Alexander St SE Unit 8475514
- 0 Alexander St SE Unit 9052025
- 0 Alexander St SE Unit 7003989
- 0 Alexander St SE Unit 7133999
- 0 Alexander St SE Unit 7326478
- 1938 Alexander St SE
- 1953 Alexander St SE
- 1933 Alexander St SE
- 1918 Alexander St SE
- 2001 Old Concord Rd
- 1910 Alexander St SE
- 1913 Alexander St SE
- 1934 Hawkins St SE
- 1942 Hawkins St SE
- 1902 Alexander St SE
- 1926 Hawkins St SE
- 1905 Alexander St SE