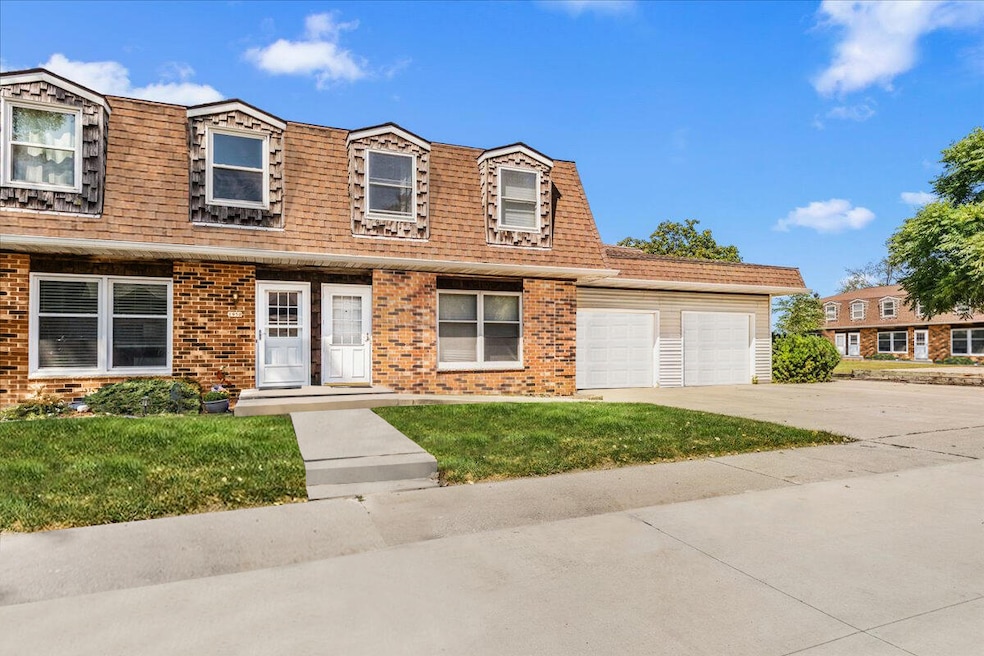
1952 Camden Ln Unit 2102 West Bend, WI 53090
Estimated payment $1,268/month
Highlights
- No HOA
- 1.5 Car Detached Garage
- 5-minute walk to Muenk Playlot
About This Home
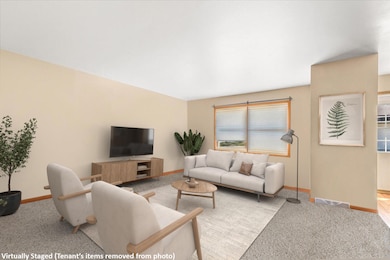
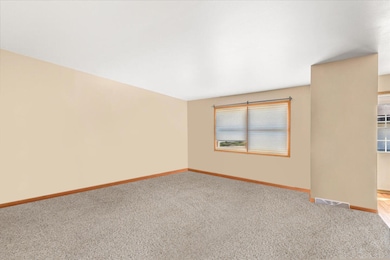
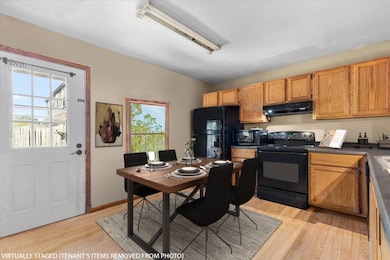
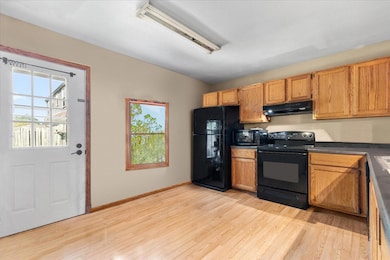
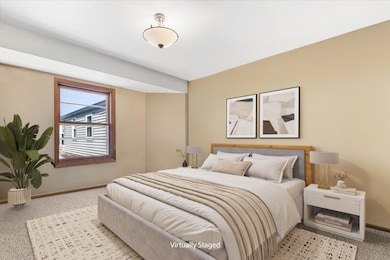
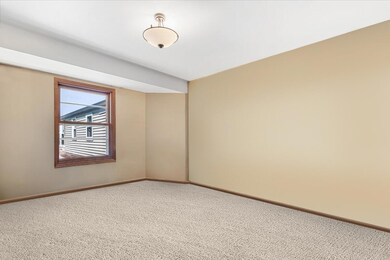
Step inside this 3 Bedroom, 1.5 Bathroom townhouse-style condo offering 1,196 sq ft plus a 590 sq ft unfinished basement! Located on a quiet cul-de-sac just minutes from freeway access, parks, schools, and shopping. The main level features a spacious living room, an eat-in kitchen with an exterior door leading to a private patio overlooking the back yard area, and a convenient half bath. Upstairs you'll find three bedrooms and a full bath. The lower level includes in-unit laundry, storage, and great potential for a future family room, office, gym, theater, or hobby room. Enjoy a private entrance, 1.5-car detached garage plus two surface spaces. Lawn care and snow removal are included in the low condo dues. Pet friendly- See Executive Summary & Condo Docs. Schedule your showing today!
Property Details
Home Type
- Condominium
Est. Annual Taxes
- $1,966
Parking
- 1.5 Car Detached Garage
Home Design
- Brick Exterior Construction
- Vinyl Siding
Interior Spaces
- 1,196 Sq Ft Home
- 2-Story Property
Kitchen
- Oven
- Range
- Dishwasher
Bedrooms and Bathrooms
- 3 Bedrooms
Laundry
- Dryer
- Washer
Basement
- Basement Fills Entire Space Under The House
- Block Basement Construction
Schools
- Green Tree Elementary School
- Badger Middle School
Community Details
- No Home Owners Association
- Association fees include lawn maintenance, snow removal, common area maintenance, trash, common area insur
Listing and Financial Details
- Exclusions: Tenants Personal Property, Microwave.
- Assessor Parcel Number 291 11190231952
Map
Home Values in the Area
Average Home Value in this Area
Tax History
| Year | Tax Paid | Tax Assessment Tax Assessment Total Assessment is a certain percentage of the fair market value that is determined by local assessors to be the total taxable value of land and additions on the property. | Land | Improvement |
|---|---|---|---|---|
| 2024 | $1,966 | $148,300 | $15,000 | $133,300 |
| 2023 | $1,758 | $95,600 | $10,000 | $85,600 |
| 2022 | $1,712 | $95,600 | $10,000 | $85,600 |
| 2021 | $1,766 | $95,600 | $10,000 | $85,600 |
| 2020 | $1,710 | $95,600 | $10,000 | $85,600 |
| 2019 | $1,663 | $95,600 | $10,000 | $85,600 |
| 2018 | $1,607 | $95,600 | $10,000 | $85,600 |
| 2017 | $1,515 | $86,700 | $10,000 | $76,700 |
| 2016 | $1,516 | $86,700 | $10,000 | $76,700 |
| 2015 | $1,615 | $86,700 | $10,000 | $76,700 |
| 2014 | $1,615 | $86,700 | $10,000 | $76,700 |
| 2013 | $1,746 | $86,700 | $10,000 | $76,700 |
Property History
| Date | Event | Price | List to Sale | Price per Sq Ft |
|---|---|---|---|---|
| 10/12/2025 10/12/25 | Pending | -- | -- | -- |
| 10/09/2025 10/09/25 | For Sale | $209,900 | -- | $176 / Sq Ft |
Purchase History
| Date | Type | Sale Price | Title Company |
|---|---|---|---|
| Quit Claim Deed | -- | None Available | |
| Quit Claim Deed | -- | None Available | |
| Condominium Deed | $97,000 | None Available | |
| Condominium Deed | $110,500 | None Available |
Mortgage History
| Date | Status | Loan Amount | Loan Type |
|---|---|---|---|
| Previous Owner | $71,900 | Future Advance Clause Open End Mortgage | |
| Previous Owner | $110,500 | New Conventional |
Source: Metro MLS
MLS Number: 1938633
APN: 1119-023-1952
Disclaimer: Certain information contained herein is derived from information provided by parties other than Homes.com. All information provided is deemed reliable, but is not guaranteed to be accurate and should be independently verified.
![]() IDX information is provided exclusively for personal, non-commercial use, and may not be used for any purpose other than to identify prospective properties consumers may be interested in purchasing.
IDX information is provided exclusively for personal, non-commercial use, and may not be used for any purpose other than to identify prospective properties consumers may be interested in purchasing.
IDX listing data provided by Multiple Listing Service, Inc. Information is supplied by seller and other third parties and has not been verified.
Copyright 2025 – Multiple Listing Service, Inc. – All Rights Reserved.
- 1900 Camden Ln
- 1010 W Sunset Ridge Dr
- 1600 Patricia Dr
- 1817 N Main St
- 1914 N River Dr
- 1904 N River Dr
- 615 Roosevelt Dr
- 7107 River Dr N
- Lt1 Dandelion Ln
- 2050 Stratford Rd
- 414 W River Dr
- Lt3 Woodford Dr
- 1708 Monroe St
- Lt2 Woodford Dr
- 1509 Monroe St
- Lt1 Sleepy Hollow Rd
- 1348 Fond du Lac St
- 329 Parkfield Dr
- 1153 N 11th Ave
- 1521 Quietwood Ln
