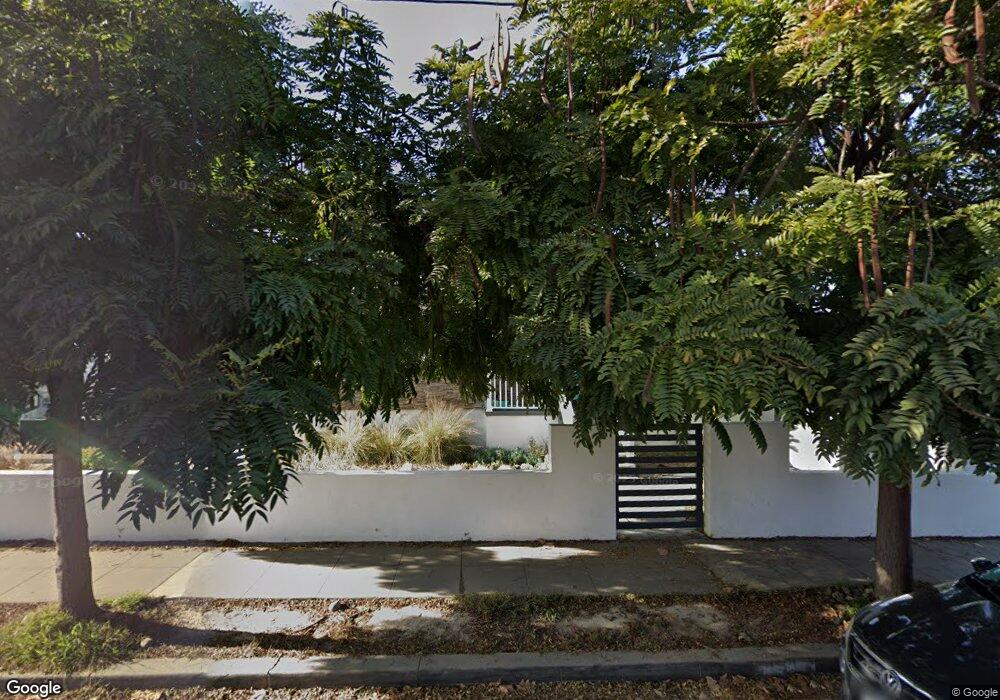
1952 Froude St San Diego, CA 92107
Ocean Beach NeighborhoodEstimated Value: $1,542,160 - $2,063,000
3
Beds
2
Baths
1,509
Sq Ft
$1,215/Sq Ft
Est. Value
About This Home
This home is located at 1952 Froude St, San Diego, CA 92107 and is currently estimated at $1,833,040, approximately $1,214 per square foot. 1952 Froude St is a home located in San Diego County with nearby schools including Ocean Beach Elementary School, Richard Henry Dana Middle School, and Correia Middle School.
Ownership History
Date
Name
Owned For
Owner Type
Purchase Details
Closed on
Mar 19, 1997
Sold by
Wilmington Trust Company
Bought by
Brownyard Robert Scott and Brownyard Teresa Lynn
Current Estimated Value
Home Financials for this Owner
Home Financials are based on the most recent Mortgage that was taken out on this home.
Original Mortgage
$176,000
Outstanding Balance
$21,002
Interest Rate
7.56%
Estimated Equity
$1,812,038
Purchase Details
Closed on
Dec 16, 1996
Sold by
Great Western Bank
Bought by
Wilmington Trust Company and Reo Property Trust 1996
Purchase Details
Closed on
Sep 4, 1996
Sold by
Coleman Anthony S
Bought by
Great Western Bank Fsb
Purchase Details
Closed on
Feb 24, 1987
Create a Home Valuation Report for This Property
The Home Valuation Report is an in-depth analysis detailing your home's value as well as a comparison with similar homes in the area
Home Values in the Area
Average Home Value in this Area
Purchase History
| Date | Buyer | Sale Price | Title Company |
|---|---|---|---|
| Brownyard Robert Scott | $220,000 | Chicago Title Co | |
| Wilmington Trust Company | -- | Chicago Title Company | |
| Great Western Bank Fsb | $127,120 | Chicago Title Co | |
| -- | $169,500 | -- |
Source: Public Records
Mortgage History
| Date | Status | Borrower | Loan Amount |
|---|---|---|---|
| Open | Brownyard Robert Scott | $176,000 | |
| Closed | Brownyard Robert Scott | $22,000 |
Source: Public Records
Tax History Compared to Growth
Tax History
| Year | Tax Paid | Tax Assessment Tax Assessment Total Assessment is a certain percentage of the fair market value that is determined by local assessors to be the total taxable value of land and additions on the property. | Land | Improvement |
|---|---|---|---|---|
| 2025 | $4,263 | $358,285 | $239,137 | $119,148 |
| 2024 | $4,263 | $351,261 | $234,449 | $116,812 |
| 2023 | $4,167 | $344,374 | $229,852 | $114,522 |
| 2022 | $4,054 | $337,623 | $225,346 | $112,277 |
| 2021 | $4,025 | $331,004 | $220,928 | $110,076 |
| 2020 | $3,976 | $327,611 | $218,663 | $108,948 |
| 2019 | $3,904 | $321,188 | $214,376 | $106,812 |
| 2018 | $3,649 | $314,891 | $210,173 | $104,718 |
| 2017 | $3,561 | $308,717 | $206,052 | $102,665 |
| 2016 | $3,502 | $302,664 | $202,012 | $100,652 |
| 2015 | $3,449 | $298,119 | $198,978 | $99,141 |
| 2014 | $3,394 | $292,280 | $195,081 | $97,199 |
Source: Public Records
Map
Nearby Homes
- 4674 Saratoga Ave Unit 2
- 2068 Guizot St
- 4545 Newport Ave
- 4725 Saratoga Ave
- 4522 Brighton Ave
- 4685 Long Branch Ave
- 4408 Brighton Ave
- 4804 Cape May Ave
- 4386 Niagara Ave
- 4420 Voltaire St
- 1817-19 Sunset Cliffs Blvd
- 4633-35 Lotus St
- 4617 Del Monte Ave
- 1988 Catalina Blvd Unit A B C
- 2187 Catalina Blvd Unit 1
- 4225 Whittier St
- 4611 Santa Cruz Ave
- 4614 Larkspur St
- 2126 San Clemente St
- 4922 Muir Ave
- 4612 Santa Monica Ave
- 1966 Froude St
- 4620 Santa Monica Ave Unit 22
- 4592 Santa Monica Ave
- 1965 Froude St
- 4626 Santa Monica Ave Unit 28
- 4586 Santa Monica Ave
- 4603 Santa Monica Ave
- 1978 Froude St Unit 80
- 4611 Santa Monica Ave
- 4630 Santa Monica Ave
- 1945 Froude St
- 1977 Froude St
- 4611 Saratoga Ave
- 4583 Santa Monica Ave Unit 87
- 4619 Santa Monica Ave
- 4617 Santa Monica Ave Unit L1
- 4621 Santa Monica Ave
- 4576 Santa Monica Ave Unit 78
- 4623 Santa Monica Ave