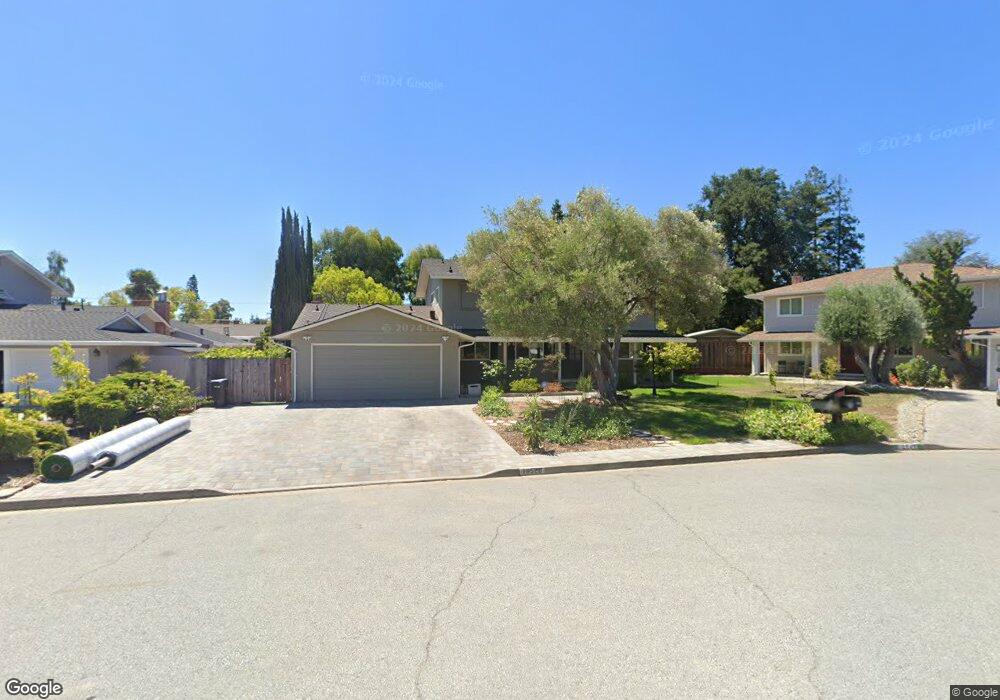
19524 Miller Ct Saratoga, CA 95070
West San Jose NeighborhoodEstimated Value: $3,912,000 - $4,283,225
3
Beds
3
Baths
2,527
Sq Ft
$1,655/Sq Ft
Est. Value
About This Home
This home is located at 19524 Miller Ct, Saratoga, CA 95070 and is currently estimated at $4,181,056, approximately $1,654 per square foot. 19524 Miller Ct is a home located in Santa Clara County with nearby schools including Blue Hills Elementary School, Joaquin Miller Middle, and Lynbrook High School.
Ownership History
Date
Name
Owned For
Owner Type
Purchase Details
Closed on
Dec 8, 2017
Sold by
Altmar David Frank and Altmar Qinghui Helen
Bought by
Altmar David Frank and Altmar Quinghui Helen
Current Estimated Value
Home Financials for this Owner
Home Financials are based on the most recent Mortgage that was taken out on this home.
Original Mortgage
$424,000
Outstanding Balance
$349,122
Interest Rate
3.12%
Mortgage Type
Adjustable Rate Mortgage/ARM
Estimated Equity
$3,831,934
Purchase Details
Closed on
Aug 16, 2017
Sold by
Xu Songjie and He Xiangyu
Bought by
Altmar David Frank and Altmar Qinghui Helen
Home Financials for this Owner
Home Financials are based on the most recent Mortgage that was taken out on this home.
Original Mortgage
$1,785,622
Outstanding Balance
$1,492,769
Interest Rate
4.03%
Mortgage Type
New Conventional
Estimated Equity
$2,688,287
Purchase Details
Closed on
Jun 28, 2005
Sold by
Powell Gary E
Bought by
Xu Songjie and He Xiangyu
Home Financials for this Owner
Home Financials are based on the most recent Mortgage that was taken out on this home.
Original Mortgage
$900,000
Interest Rate
5.55%
Mortgage Type
Fannie Mae Freddie Mac
Create a Home Valuation Report for This Property
The Home Valuation Report is an in-depth analysis detailing your home's value as well as a comparison with similar homes in the area
Home Values in the Area
Average Home Value in this Area
Purchase History
| Date | Buyer | Sale Price | Title Company |
|---|---|---|---|
| Altmar David Frank | -- | None Available | |
| Altmar David Frank | -- | Wfg Natl Title Ins Co | |
| Altmar David Frank | $2,551,000 | Cornerstone Title Company | |
| Xu Songjie | $1,415,000 | New Century Title Company |
Source: Public Records
Mortgage History
| Date | Status | Borrower | Loan Amount |
|---|---|---|---|
| Open | Altmar David Frank | $424,000 | |
| Open | Altmar David Frank | $1,785,622 | |
| Previous Owner | Xu Songjie | $900,000 |
Source: Public Records
Tax History Compared to Growth
Tax History
| Year | Tax Paid | Tax Assessment Tax Assessment Total Assessment is a certain percentage of the fair market value that is determined by local assessors to be the total taxable value of land and additions on the property. | Land | Improvement |
|---|---|---|---|---|
| 2025 | $33,973 | $2,902,471 | $2,048,091 | $854,380 |
| 2024 | $33,973 | $2,845,561 | $2,007,933 | $837,628 |
| 2023 | $33,704 | $2,789,766 | $1,968,562 | $821,204 |
| 2022 | $33,262 | $2,735,065 | $1,929,963 | $805,102 |
| 2021 | $32,918 | $2,681,437 | $1,892,121 | $789,316 |
| 2020 | $31,641 | $2,580,000 | $1,820,500 | $759,500 |
| 2019 | $31,749 | $2,601,905 | $1,836,000 | $765,905 |
| 2018 | $30,998 | $2,550,888 | $1,800,000 | $750,888 |
| 2017 | $20,971 | $1,665,856 | $1,312,611 | $353,245 |
| 2016 | $20,299 | $1,633,193 | $1,286,874 | $346,319 |
| 2015 | $20,143 | $1,608,661 | $1,267,544 | $341,117 |
| 2014 | $19,622 | $1,577,150 | $1,242,715 | $334,435 |
Source: Public Records
Map
Nearby Homes
- 1681 Danromas Way
- 12140 Woodside Dr
- 1587 Miller Ave
- 19920 Viewridge Dr
- 13010 Glen Brae Dr
- 12790 Glen Arbor Ct
- 19437 Via Real Dr
- 19423 Vineyard Ln
- 19662 Via Grande Dr
- 19113 Vineyard Ln
- 5635 W Walbrook Dr
- 11010 Maple Place Unit 25-06 Plan 4
- 10750 Elm Cir Unit 88-17 Plan 2
- 10730 Elm Cir Unit 86-17 Plan 2
- 11315 Cottonwood Place Unit 39-09 Plan 3
- Plan 2 at The Elms
- Plan 3 at The Elms
- Plan 4 at The Elms
- 11645 Redwood Place Unit 56-12 Plan 4
- 11210 Cottonwood Place Unit 35-08 Plan 4
- 19528 Miller Ct
- 19502 Miller Ct
- 19546 Miller Ct
- 19545 Northampton Dr
- 19523 Northampton Dr
- 19490 Miller Ct
- 19567 Northampton Dr
- 19567 Miller Ct
- 19523 Miller Ct
- 19501 Northampton Dr Unit 3
- 19545 Miller Ct
- 19501 Miller Ct
- 19478 Miller Ct
- 12364 Larchmont Ave
- 12386 Larchmont Ave
- 19487 Miller Ct
- 19589 Northampton Dr
- 19489 Northampton Dr
- 12342 Larchmont Ave
- 19546 Northampton Dr