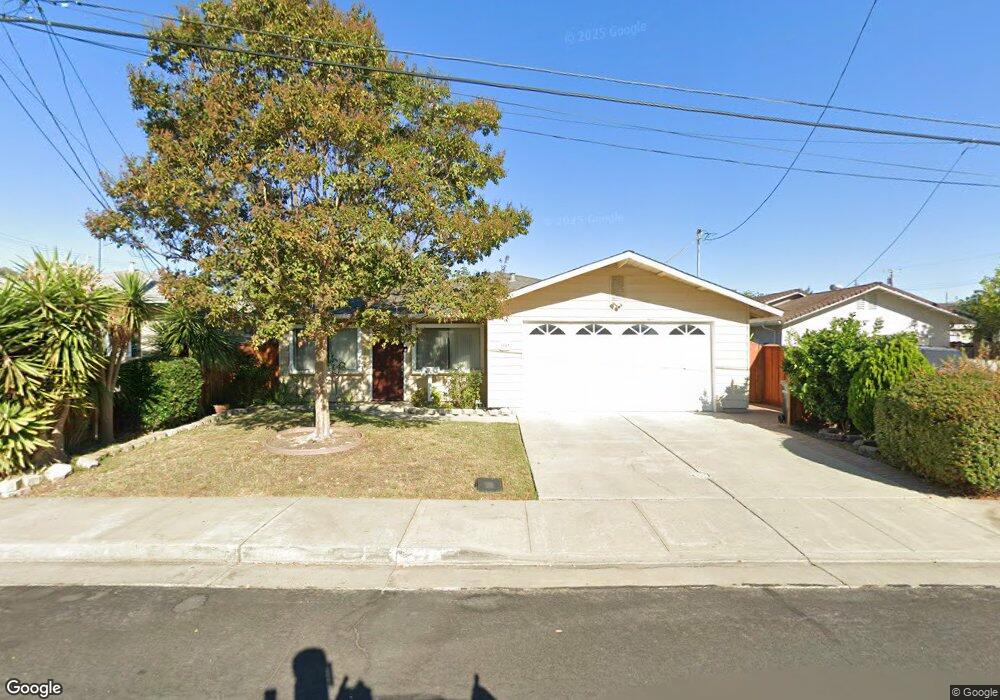
1953 Beech St Santa Clara, CA 95054
North Santa Clara NeighborhoodEstimated Value: $1,236,000 - $1,376,674
3
Beds
2
Baths
1,243
Sq Ft
$1,046/Sq Ft
Est. Value
About This Home
This home is located at 1953 Beech St, Santa Clara, CA 95054 and is currently estimated at $1,299,669, approximately $1,045 per square foot. 1953 Beech St is a home located in Santa Clara County with nearby schools including Kathryn Hughes Elementary School, Buchser Middle School, and Santa Clara High School.
Ownership History
Date
Name
Owned For
Owner Type
Purchase Details
Closed on
Nov 20, 2012
Sold by
Nguyen Lam T
Bought by
Nguyen Lam T and Pham Hong Yen Thuy
Current Estimated Value
Purchase Details
Closed on
Feb 10, 2012
Sold by
Pham Hong Yen Thuy
Bought by
Nguyen Lam T
Home Financials for this Owner
Home Financials are based on the most recent Mortgage that was taken out on this home.
Original Mortgage
$320,000
Outstanding Balance
$218,707
Interest Rate
3.84%
Mortgage Type
New Conventional
Estimated Equity
$1,080,962
Purchase Details
Closed on
Jan 18, 2012
Sold by
Nguyen Lam T
Bought by
Nguyen Lam T
Home Financials for this Owner
Home Financials are based on the most recent Mortgage that was taken out on this home.
Original Mortgage
$320,000
Outstanding Balance
$218,707
Interest Rate
3.84%
Mortgage Type
New Conventional
Estimated Equity
$1,080,962
Purchase Details
Closed on
Jun 23, 2011
Sold by
Uy Ma Rosalie M and Uy Mark Chester S
Bought by
Nguyen Lam T
Home Financials for this Owner
Home Financials are based on the most recent Mortgage that was taken out on this home.
Original Mortgage
$304,000
Interest Rate
4.54%
Mortgage Type
New Conventional
Purchase Details
Closed on
Feb 9, 2007
Sold by
Carroll Terrence and Carroll Lucy
Bought by
Uy Ma Rosalie M and Uy Mark Chester S
Home Financials for this Owner
Home Financials are based on the most recent Mortgage that was taken out on this home.
Original Mortgage
$133,000
Interest Rate
6.21%
Mortgage Type
Stand Alone Second
Purchase Details
Closed on
Dec 15, 2004
Sold by
Norton Readith and Norton Harold
Bought by
Carroll Terrence and Carroll Lucy
Home Financials for this Owner
Home Financials are based on the most recent Mortgage that was taken out on this home.
Original Mortgage
$460,000
Interest Rate
5%
Mortgage Type
Purchase Money Mortgage
Purchase Details
Closed on
Jun 24, 1998
Sold by
Norton Harold N
Bought by
Norton Readith and Lawson Readith
Home Financials for this Owner
Home Financials are based on the most recent Mortgage that was taken out on this home.
Original Mortgage
$210,000
Interest Rate
7.17%
Purchase Details
Closed on
Apr 17, 1996
Sold by
Lawson Readith and Pinkerton Clarence
Bought by
Lawson Readith
Home Financials for this Owner
Home Financials are based on the most recent Mortgage that was taken out on this home.
Original Mortgage
$160,000
Interest Rate
10.5%
Create a Home Valuation Report for This Property
The Home Valuation Report is an in-depth analysis detailing your home's value as well as a comparison with similar homes in the area
Home Values in the Area
Average Home Value in this Area
Purchase History
| Date | Buyer | Sale Price | Title Company |
|---|---|---|---|
| Nguyen Lam T | -- | None Available | |
| Nguyen Lam T | -- | Fidelity National Title Co | |
| Nguyen Lam T | -- | Fidelity National Title Co | |
| Nguyen Lam T | $380,000 | Chicago Title Company | |
| Uy Ma Rosalie M | $665,000 | North American Title Company | |
| Carroll Terrence | $575,000 | North American Title Company | |
| Norton Readith | -- | Commonwealth Land Title Co | |
| Lawson Readith | $80,000 | Commonwealth Land Title Co |
Source: Public Records
Mortgage History
| Date | Status | Borrower | Loan Amount |
|---|---|---|---|
| Open | Nguyen Lam T | $320,000 | |
| Closed | Nguyen Lam T | $320,000 | |
| Closed | Nguyen Lam T | $304,000 | |
| Previous Owner | Uy Ma Rosalie M | $133,000 | |
| Previous Owner | Uy Ma Rosalie M | $532,000 | |
| Previous Owner | Carroll Terrence | $460,000 | |
| Previous Owner | Norton Readith | $210,000 | |
| Previous Owner | Lawson Readith | $160,000 | |
| Closed | Carroll Terrence | $86,250 |
Source: Public Records
Tax History Compared to Growth
Tax History
| Year | Tax Paid | Tax Assessment Tax Assessment Total Assessment is a certain percentage of the fair market value that is determined by local assessors to be the total taxable value of land and additions on the property. | Land | Improvement |
|---|---|---|---|---|
| 2025 | $5,607 | $486,834 | $292,103 | $194,731 |
| 2024 | $5,607 | $477,289 | $286,376 | $190,913 |
| 2023 | $5,549 | $467,931 | $280,761 | $187,170 |
| 2022 | $5,457 | $458,756 | $275,256 | $183,500 |
| 2021 | $5,433 | $449,761 | $269,859 | $179,902 |
| 2020 | $5,333 | $445,150 | $267,092 | $178,058 |
| 2019 | $5,326 | $436,422 | $261,855 | $174,567 |
| 2018 | $4,985 | $427,866 | $256,721 | $171,145 |
| 2017 | $4,959 | $419,478 | $251,688 | $167,790 |
| 2016 | $4,887 | $411,253 | $246,753 | $164,500 |
| 2015 | $4,867 | $405,077 | $243,047 | $162,030 |
| 2014 | $4,617 | $397,144 | $238,287 | $158,857 |
Source: Public Records
Map
Nearby Homes
- 1752 Beech St
- 1900 Chestnut St
- 2200 Agnew Rd Unit 212
- 2200 Agnew Rd Unit 118
- 1883 Agnew Rd Unit 301
- 1883 Agnew Rd Unit 341
- 1883 Agnew Rd Unit 367
- 4503 Cheeney St
- 4216 Atlantic Ct
- 1898 Garzoni Place
- 1901 Garzoni Place Unit 405
- 930 Clyde Ave
- 920 Clyde Ave
- 4676 Wilcox Ave
- 4699 Snead Dr
- 783 Laurie Ave
- 2313 Villa Place
- 4464 Laird Cir
- 4012 Fitzpatrick Way Unit 3
- 3901 Lick Mill Blvd Unit 358