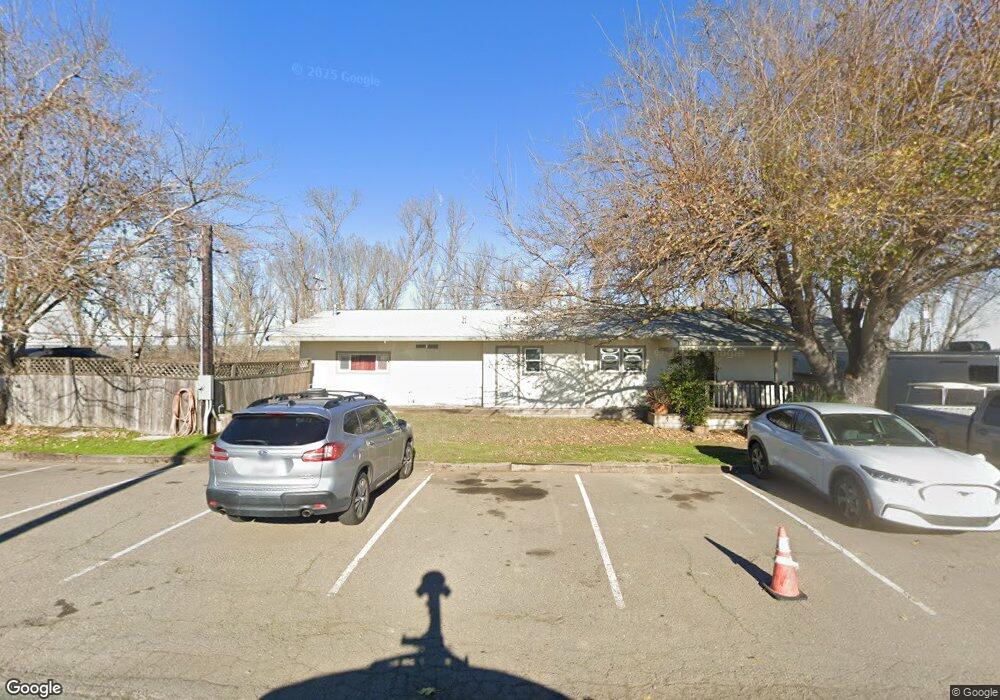
19530 Sherman Island East Levee Rd Rio Vista, CA 94571
--
Bed
--
Bath
1,464
Sq Ft
3.79
Acres
About This Home
This home is located at 19530 Sherman Island East Levee Rd, Rio Vista, CA 94571. 19530 Sherman Island East Levee Rd is a home located in Sacramento County with nearby schools including Isleton Elementary School, Riverview Middle School, and Rio Vista High School.
Ownership History
Date
Name
Owned For
Owner Type
Purchase Details
Closed on
Jul 26, 2022
Sold by
Gulick Christopher P
Bought by
Gulick Christopher P
Purchase Details
Closed on
Jul 20, 2005
Sold by
Gulick Christopher P
Bought by
Gulick Christopher P
Purchase Details
Closed on
Jan 25, 2001
Sold by
Gulick John C
Bought by
Gulick John C
Purchase Details
Closed on
Nov 6, 2000
Sold by
John C & Ellen L Gulick Family Trust
Bought by
Gulick John C and Gulick Ellen L
Home Financials for this Owner
Home Financials are based on the most recent Mortgage that was taken out on this home.
Original Mortgage
$50,000
Interest Rate
7.86%
Mortgage Type
Commercial
Purchase Details
Closed on
Oct 20, 2000
Sold by
Gulick Ellen L
Bought by
Gulick John C
Home Financials for this Owner
Home Financials are based on the most recent Mortgage that was taken out on this home.
Original Mortgage
$50,000
Interest Rate
7.86%
Mortgage Type
Commercial
Create a Home Valuation Report for This Property
The Home Valuation Report is an in-depth analysis detailing your home's value as well as a comparison with similar homes in the area
Home Values in the Area
Average Home Value in this Area
Purchase History
| Date | Buyer | Sale Price | Title Company |
|---|---|---|---|
| Gulick Christopher P | -- | Lennar Title Inc | |
| Gulick Christopher P | -- | Lennar Title Inc | |
| Gulick Christopher P | -- | -- | |
| Gulick John C | -- | -- | |
| Gulick John C | -- | -- | |
| Gulick John C | -- | -- |
Source: Public Records
Mortgage History
| Date | Status | Borrower | Loan Amount |
|---|---|---|---|
| Previous Owner | Gulick John C | $50,000 |
Source: Public Records
Tax History Compared to Growth
Tax History
| Year | Tax Paid | Tax Assessment Tax Assessment Total Assessment is a certain percentage of the fair market value that is determined by local assessors to be the total taxable value of land and additions on the property. | Land | Improvement |
|---|---|---|---|---|
| 2025 | $5,106 | $449,362 | $82,696 | $366,666 |
| 2024 | $5,106 | $440,552 | $81,075 | $359,477 |
| 2023 | $5,082 | $431,915 | $79,486 | $352,429 |
| 2022 | $4,937 | $423,447 | $77,928 | $345,519 |
| 2021 | $4,865 | $415,145 | $76,400 | $338,745 |
| 2020 | $5,263 | $410,889 | $75,617 | $335,272 |
| 2019 | $5,098 | $402,834 | $74,135 | $328,699 |
| 2018 | $5,202 | $394,936 | $72,682 | $322,254 |
| 2017 | $4,979 | $387,193 | $71,257 | $315,936 |
| 2016 | $4,910 | $379,602 | $69,860 | $309,742 |
| 2015 | $4,915 | $373,901 | $68,811 | $305,090 |
| 2014 | $4,878 | $366,578 | $67,464 | $299,114 |
Source: Public Records
Map
Nearby Homes
- 71 Taylor Place
- 1410 Taylor Rd
- 1472 Taylor Rd
- 0 Sherman Island East Levee Rd Unit 225095595
- 1596 Taylor Rd
- 19900 Sherman Island Cross Rd
- 400 Beyers St
- 739 Temescal St
- 1480 Taylor Rd
- 2108 Taylor Rd
- 2172 Taylor Rd
- 1384 Rutherford Ln
- 0 Bradford Island Unit 41099773
- 85 Duckhorn Place
- 2325 Taylor Rd
- 321 Lakespring Place
- 80 Duckhorn Place
- 521 Freemark Ln
- 3147 W Willow Rd
- 736 Walnut Ranch Way
- 1 Sherman Island East Levee Rd
- 0 W Sherman Is Levee Rd Unit 17073442
- 0 Sherman Is Levee Rd Unit 17073440
- 8 Sherman Is Levee Rd
- 0 Sherman Is Levee Rd Unit 21726619
- 8 Sherman Island East Levee Rd
- 00 Sherman Island Levee Rd
- 0 Sherman Island Levee Rd Unit 40666922
- 19250 Sherman Island East Le Rd
- 19250 Sherman Island East Le Rd
- 19250 Sherman Island E Le Rd
- 19250 Sherman Island East Le Rd
- 0 Jersey Island Rd