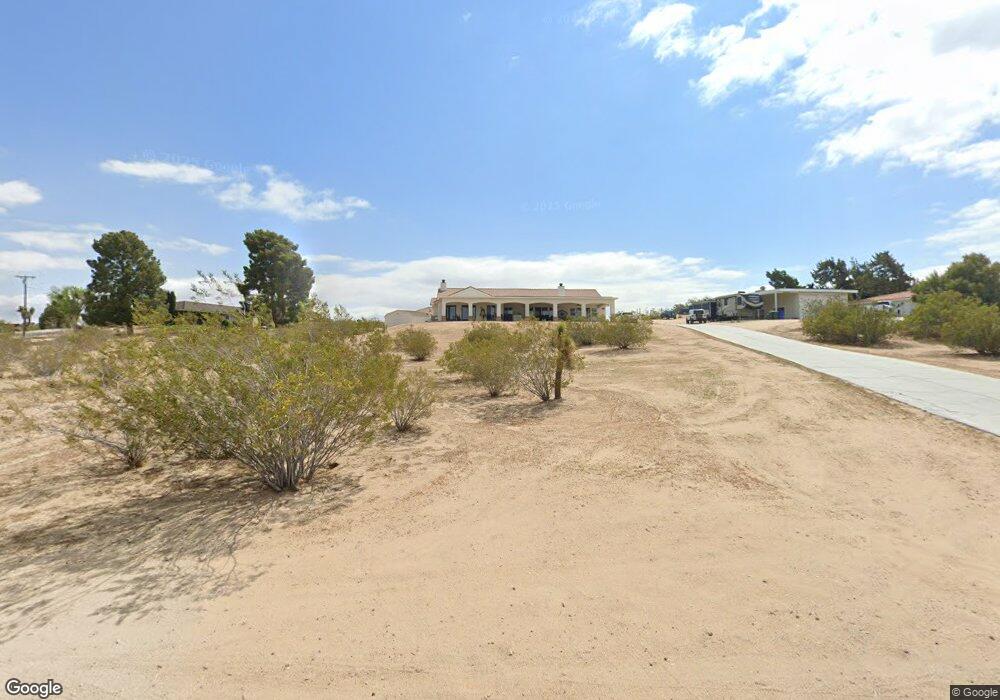
19531 Tonto Rd Apple Valley, CA 92307
High Desert NeighborhoodEstimated Value: $686,000 - $902,000
5
Beds
4
Baths
3,698
Sq Ft
$214/Sq Ft
Est. Value
About This Home
This home is located at 19531 Tonto Rd, Apple Valley, CA 92307 and is currently estimated at $789,924, approximately $213 per square foot. 19531 Tonto Rd is a home located in San Bernardino County with nearby schools including Rio Vista School of Applied Learning, Granite Hills High School, and Academy for Academic Excellence.
Ownership History
Date
Name
Owned For
Owner Type
Purchase Details
Closed on
Nov 1, 2007
Sold by
Dejong Shawn E
Bought by
Dejong Shawn E and Dejong Dawn
Current Estimated Value
Home Financials for this Owner
Home Financials are based on the most recent Mortgage that was taken out on this home.
Original Mortgage
$417,000
Outstanding Balance
$261,410
Interest Rate
6.29%
Mortgage Type
New Conventional
Estimated Equity
$528,514
Purchase Details
Closed on
Oct 2, 2007
Sold by
Dejong Dawn
Bought by
Dejong Shawn Eugene
Home Financials for this Owner
Home Financials are based on the most recent Mortgage that was taken out on this home.
Original Mortgage
$417,000
Outstanding Balance
$261,410
Interest Rate
6.29%
Mortgage Type
New Conventional
Estimated Equity
$528,514
Purchase Details
Closed on
Sep 6, 2006
Sold by
Dejong Shawn E
Bought by
Dejong Shawn E and Dejong Dawn
Purchase Details
Closed on
Oct 25, 2005
Sold by
Gates Cole Dawn L
Bought by
Dejong Shawn E
Create a Home Valuation Report for This Property
The Home Valuation Report is an in-depth analysis detailing your home's value as well as a comparison with similar homes in the area
Home Values in the Area
Average Home Value in this Area
Purchase History
| Date | Buyer | Sale Price | Title Company |
|---|---|---|---|
| Dejong Shawn E | -- | Accommodation | |
| Dejong Shawn Eugene | -- | Chicago Title Company | |
| Dejong Shawn E | -- | Accommodation | |
| Dejong Shawn E | -- | First American | |
| Dejong Shawn E | -- | First American |
Source: Public Records
Mortgage History
| Date | Status | Borrower | Loan Amount |
|---|---|---|---|
| Open | Dejong Shawn Eugene | $417,000 |
Source: Public Records
Tax History Compared to Growth
Tax History
| Year | Tax Paid | Tax Assessment Tax Assessment Total Assessment is a certain percentage of the fair market value that is determined by local assessors to be the total taxable value of land and additions on the property. | Land | Improvement |
|---|---|---|---|---|
| 2025 | $8,200 | $731,124 | $211,821 | $519,303 |
| 2024 | $8,200 | $716,789 | $207,668 | $509,121 |
| 2023 | $8,127 | $702,734 | $203,596 | $499,138 |
| 2022 | $7,336 | $636,000 | $127,000 | $509,000 |
| 2021 | $6,463 | $561,000 | $112,000 | $449,000 |
| 2020 | $6,006 | $521,500 | $103,900 | $417,600 |
| 2019 | $5,678 | $492,000 | $98,000 | $394,000 |
| 2018 | $5,593 | $488,900 | $81,400 | $407,500 |
| 2017 | $5,266 | $456,900 | $76,100 | $380,800 |
| 2016 | $4,838 | $423,100 | $70,500 | $352,600 |
| 2015 | $4,465 | $390,000 | $65,000 | $325,000 |
| 2014 | $4,314 | $373,000 | $75,000 | $298,000 |
Source: Public Records
Map
Nearby Homes
- 19446 Shoshonee Rd
- 14118 Monte Verde Ave
- 19545 Oshkosh Ln
- 13827 Olathe Rd
- 14006 Cronese Rd
- 13724 Chateau Ct
- 0 Choco Rd Unit HD25163962
- 0 Choco Rd Unit HD25067276
- 0 Choco Rd Unit HD24105766
- 19891 Talihina Rd
- 19804 Haida Rd
- 13771 Wawona Rd
- 14287 Bochee Rd
- 19955 Shoshonee Rd
- 19678 Red Feather Rd
- 14024 Delaware Rd
- 19824 Yucca Loma Rd
- 19391 Seneca Rd
- 13955 Cuyamaca Rd
- 19924 Sunset Ln
- 19521 Tonto Rd
- 14010 Pamlico Rd
- 19555 Shoshonee Rd
- 19408 Tonto Rd
- 19500 Tonto Rd
- 19515 Tonto Rd
- 13988 Pamlico Rd
- 14044 Pamlico Rd
- 19490 Tonto Rd
- 19530 Shoshonee Rd
- 19471 Shoshonee Rd
- 19558 Shoshonee Rd
- 19489 Tonto Rd
- 19186 Shoshonee Rd
- 19584 Shoshonee Rd
- 19610 Crest Dr
- 19452 Tonto Rd
- 13944 Pamlico Rd
- 14021 Pamlico Rd
- 19585 Crest Dr