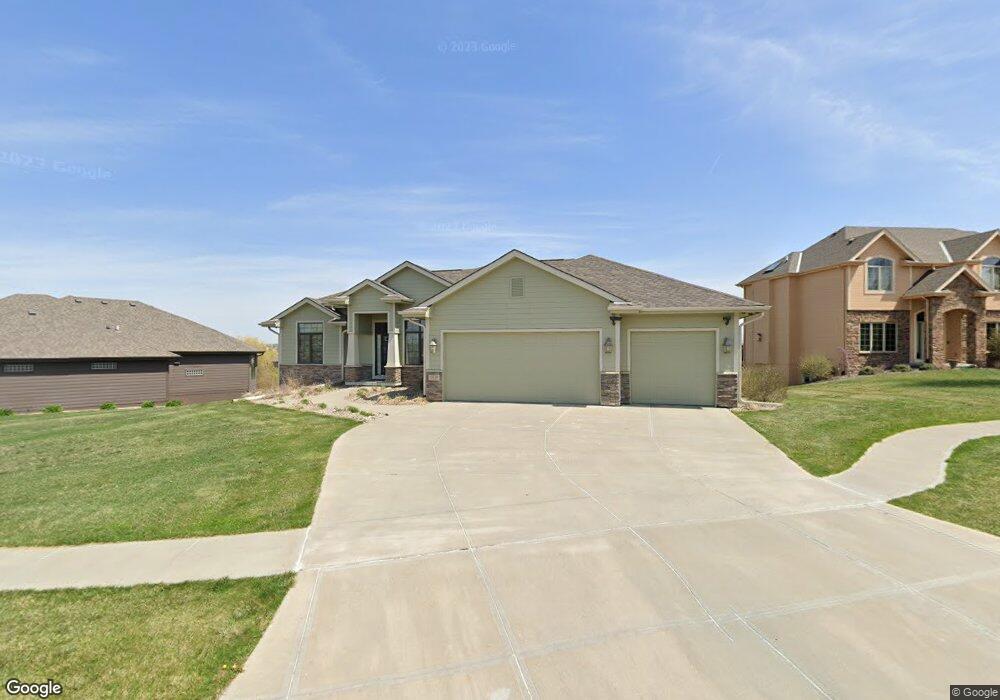
19538 Bellbrook Blvd Gretna, NE 68028
Estimated Value: $507,260 - $549,000
3
Beds
3
Baths
2,077
Sq Ft
$256/Sq Ft
Est. Value
About This Home
This home is located at 19538 Bellbrook Blvd, Gretna, NE 68028 and is currently estimated at $531,565, approximately $255 per square foot. 19538 Bellbrook Blvd is a home located in Sarpy County with nearby schools including Reeder Elementary School, Beadle Middle School, and Millard West High School.
Ownership History
Date
Name
Owned For
Owner Type
Purchase Details
Closed on
Dec 23, 2014
Sold by
Willson Cyril M and Willson Ashley J
Bought by
Willson Dean D
Current Estimated Value
Purchase Details
Closed on
Mar 11, 2010
Sold by
Todd Menard Construction Llc
Bought by
Wilson Cyril M and Wilson Ashley J
Home Financials for this Owner
Home Financials are based on the most recent Mortgage that was taken out on this home.
Original Mortgage
$322,000
Interest Rate
4.93%
Mortgage Type
Construction
Purchase Details
Closed on
Sep 15, 2005
Sold by
Bellbrook Development Llc
Bought by
Osborn Douglas M and Osborn Gloria S
Home Financials for this Owner
Home Financials are based on the most recent Mortgage that was taken out on this home.
Original Mortgage
$750,000
Outstanding Balance
$402,008
Interest Rate
5.88%
Mortgage Type
Credit Line Revolving
Estimated Equity
$129,557
Create a Home Valuation Report for This Property
The Home Valuation Report is an in-depth analysis detailing your home's value as well as a comparison with similar homes in the area
Home Values in the Area
Average Home Value in this Area
Purchase History
| Date | Buyer | Sale Price | Title Company |
|---|---|---|---|
| Willson Dean D | -- | None Available | |
| Wilson Cyril M | $50,000 | None Available | |
| Osborn Douglas M | $256,000 | -- |
Source: Public Records
Mortgage History
| Date | Status | Borrower | Loan Amount |
|---|---|---|---|
| Closed | Wilson Cyril M | $322,000 | |
| Open | Osborn Douglas M | $750,000 |
Source: Public Records
Tax History Compared to Growth
Tax History
| Year | Tax Paid | Tax Assessment Tax Assessment Total Assessment is a certain percentage of the fair market value that is determined by local assessors to be the total taxable value of land and additions on the property. | Land | Improvement |
|---|---|---|---|---|
| 2025 | $8,266 | $519,433 | $47,310 | $472,123 |
| 2024 | $9,165 | $502,440 | $47,310 | $455,130 |
| 2023 | $9,165 | $457,499 | $39,900 | $417,599 |
| 2022 | $8,987 | $416,568 | $37,050 | $379,518 |
| 2021 | $8,450 | $387,434 | $36,195 | $351,239 |
| 2020 | $8,544 | $382,074 | $36,195 | $345,879 |
| 2019 | $8,103 | $361,578 | $36,195 | $325,383 |
| 2018 | $8,294 | $356,893 | $30,780 | $326,113 |
| 2017 | $8,356 | $352,492 | $30,780 | $321,712 |
| 2016 | $8,388 | $351,802 | $29,640 | $322,162 |
| 2015 | $8,541 | $347,623 | $29,640 | $317,983 |
| 2014 | $8,581 | $334,758 | $29,640 | $305,118 |
| 2012 | -- | $324,124 | $27,360 | $296,764 |
Source: Public Records
Map
Nearby Homes
- 19523 Josephine St
- 7112 S 193rd St
- 19603 Brookside Ln
- 19821 Emiline St
- 7819 S 194th Ave
- 18921 Lillian St
- 6726 S 198th St
- 19823 Bellbrook Blvd
- 8004 S 195th St
- 19802 Cottonwood St
- 7710 S 198th St
- 7808 S 190 Ave
- 10416 S 191st St
- 10219 S 191st St
- 19965 Polk St
- 20003 Polk St
- 7712 S 199th St
- 19760 Briar St
- 20970 Polk St
- 4549 S 203rd St
- 19527 Josephine St
- 19534 Bellbrook Blvd
- 19601 Bellbrook Blvd
- 19531 Bellbrook Blvd
- 19604 Bellbrook Blvd
- 19519 Josephine St
- 19530 Bellbrook Blvd
- 19527 Bellbrook Blvd
- 19605 Bellbrook Blvd
- 19608 Bellbrook Blvd
- 19605 Chandler St
- 19526 Bellbrook Blvd
- 19515 Josephine St
- 19610 Chandler St
- 19334 Bellbrook Blvd
- 19330 Bellbrook Blvd
- 19524 Josephine St
- 19338 Bellbrook Blvd
- 19609 Bellbrook Blvd
- 7313 S 196th Cir