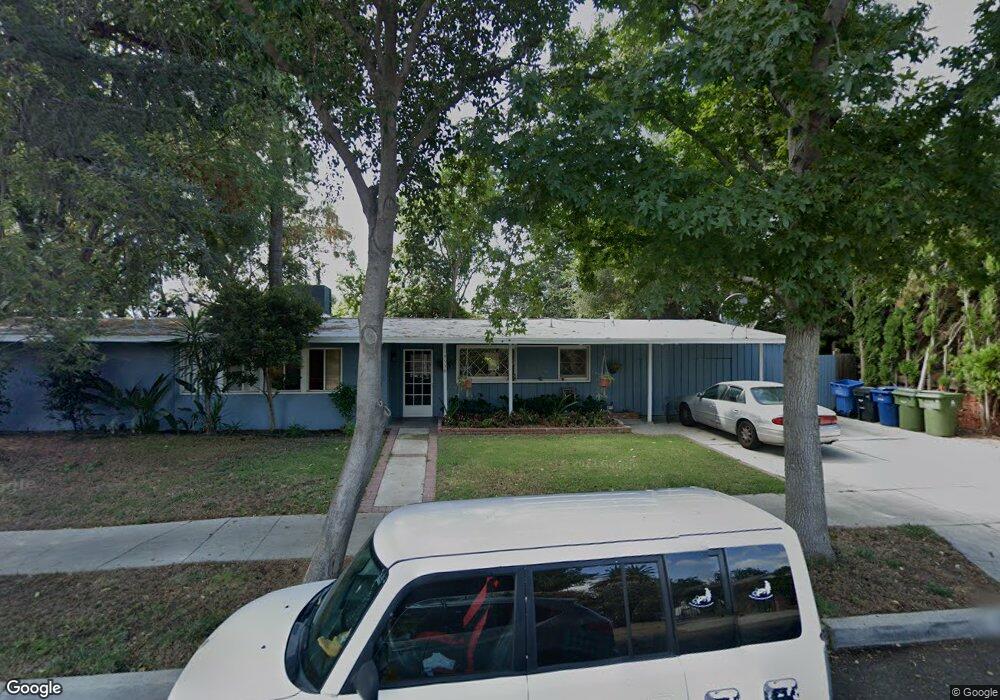
19538 Strathern St Reseda, CA 91335
Estimated Value: $906,000 - $1,039,000
4
Beds
2
Baths
2,213
Sq Ft
$433/Sq Ft
Est. Value
About This Home
This home is located at 19538 Strathern St, Reseda, CA 91335 and is currently estimated at $957,885, approximately $432 per square foot. 19538 Strathern St is a home located in Los Angeles County with nearby schools including Melvin Avenue Elementary School, John A. Sutter Middle School, and Northridge Academy High.
Ownership History
Date
Name
Owned For
Owner Type
Purchase Details
Closed on
Jan 19, 2021
Sold by
Howe John Wilson and Famil Carole
Bought by
John Wilson Howe And Carole R Howe Family Tru and Howe
Current Estimated Value
Home Financials for this Owner
Home Financials are based on the most recent Mortgage that was taken out on this home.
Original Mortgage
$1,095,000
Outstanding Balance
$335,153
Interest Rate
6.8%
Mortgage Type
Reverse Mortgage Home Equity Conversion Mortgage
Estimated Equity
$622,732
Purchase Details
Closed on
Apr 28, 2018
Sold by
Howe John Wilson
Bought by
Howe John Wilson and Howe Carole R
Purchase Details
Closed on
Jun 5, 2017
Sold by
Howe John W
Bought by
Howe John W and Howe Carole
Home Financials for this Owner
Home Financials are based on the most recent Mortgage that was taken out on this home.
Original Mortgage
$817,500
Interest Rate
4.22%
Mortgage Type
Reverse Mortgage Home Equity Conversion Mortgage
Create a Home Valuation Report for This Property
The Home Valuation Report is an in-depth analysis detailing your home's value as well as a comparison with similar homes in the area
Home Values in the Area
Average Home Value in this Area
Purchase History
| Date | Buyer | Sale Price | Title Company |
|---|---|---|---|
| John Wilson Howe And Carole R Howe Family Tru | -- | Wfg National Title Insurance C | |
| Howe John Wilson | -- | None Available | |
| Howe John W | -- | Chicago Title Company |
Source: Public Records
Mortgage History
| Date | Status | Borrower | Loan Amount |
|---|---|---|---|
| Open | John Wilson Howe And Carole R Howe Family Tru | $1,095,000 | |
| Closed | John Wilson Howe And Carole R Howe Family Tru | $1,095,000 | |
| Previous Owner | Howe John W | $817,500 |
Source: Public Records
Tax History
| Year | Tax Paid | Tax Assessment Tax Assessment Total Assessment is a certain percentage of the fair market value that is determined by local assessors to be the total taxable value of land and additions on the property. | Land | Improvement |
|---|---|---|---|---|
| 2025 | $2,461 | $187,943 | $59,314 | $128,629 |
| 2024 | $2,461 | $184,258 | $58,151 | $126,107 |
| 2023 | $2,417 | $180,646 | $57,011 | $123,635 |
| 2022 | $2,311 | $177,105 | $55,894 | $121,211 |
| 2021 | $2,269 | $173,634 | $54,799 | $118,835 |
| 2020 | $2,286 | $171,855 | $54,238 | $117,617 |
| 2019 | $2,204 | $168,486 | $53,175 | $115,311 |
| 2018 | $2,150 | $165,183 | $52,133 | $113,050 |
| 2016 | $2,030 | $158,770 | $50,109 | $108,661 |
| 2015 | $2,001 | $156,386 | $49,357 | $107,029 |
| 2014 | $2,018 | $153,324 | $48,391 | $104,933 |
Source: Public Records
Map
Nearby Homes
- 19516 Blythe St
- 7959 Bothwell Rd
- 19462 Arminta St
- 8008 Aura Ave
- 19620 Roscoe Blvd Unit D
- 19211 Strathern St
- 8240 Chamberlain Ln
- 19946 Lorne St
- 19828 Lull St
- 20017 Hemmingway St
- 19158 Roscoe Blvd
- 7554 Corbin Ave Unit 4
- 19106 Cantara St
- 7527 Tampa Ave Unit 1
- 19858 Saticoy St
- 20107 Baltar St
- 19046 Schoenborn St
- 7414 Quartz Ave
- 7514 Beckford Ave
- 20010 Eccles St
- 19530 Strathern St
- 19548 Strathern St
- 19541 Blythe St
- 19533 Blythe St
- 19549 Blythe St
- 19525 Blythe St
- 19520 Strathern St
- 19558 Strathern St
- 19557 Blythe St
- 19541 Strathern St
- 19533 Strathern St
- 19551 Strathern St
- 19517 Blythe St
- 19538 Blythe St
- 19565 Blythe St
- 19546 Blythe St
- 19530 Blythe St
- 19523 Strathern St
- 19510 Strathern St
- 19600 Strathern St
Your Personal Tour Guide
Ask me questions while you tour the home.