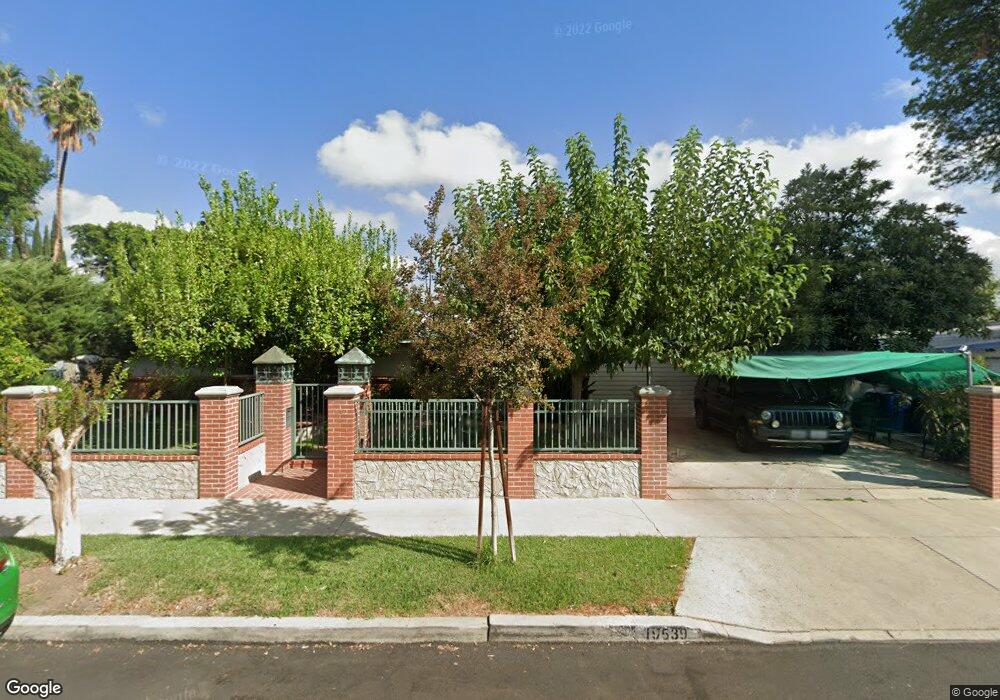
19539 Keswick St Reseda, CA 91335
Estimated Value: $662,312 - $743,000
2
Beds
1
Bath
914
Sq Ft
$768/Sq Ft
Est. Value
About This Home
This home is located at 19539 Keswick St, Reseda, CA 91335 and is currently estimated at $701,828, approximately $767 per square foot. 19539 Keswick St is a home located in Los Angeles County with nearby schools including Melvin Avenue Elementary School, John A. Sutter Middle School, and Northridge Academy High.
Ownership History
Date
Name
Owned For
Owner Type
Purchase Details
Closed on
Sep 10, 2022
Sold by
Elena Rochin and Elena Luz
Bought by
Feliciano And Luz Elena Rochin Living Trust
Current Estimated Value
Purchase Details
Closed on
Feb 20, 2001
Sold by
Bolanos Gladys P
Bought by
Rochin Feliciano
Home Financials for this Owner
Home Financials are based on the most recent Mortgage that was taken out on this home.
Original Mortgage
$161,435
Interest Rate
6.98%
Mortgage Type
FHA
Purchase Details
Closed on
May 18, 1995
Sold by
Elena Deuriarte Trust
Bought by
Bolanos Gladys P
Home Financials for this Owner
Home Financials are based on the most recent Mortgage that was taken out on this home.
Original Mortgage
$103,500
Interest Rate
7.88%
Create a Home Valuation Report for This Property
The Home Valuation Report is an in-depth analysis detailing your home's value as well as a comparison with similar homes in the area
Home Values in the Area
Average Home Value in this Area
Purchase History
| Date | Buyer | Sale Price | Title Company |
|---|---|---|---|
| Feliciano And Luz Elena Rochin Living Trust | -- | -- | |
| Rochin Feliciano | $164,000 | South Coast Title | |
| Bolanos Gladys P | $115,000 | First American Title Co |
Source: Public Records
Mortgage History
| Date | Status | Borrower | Loan Amount |
|---|---|---|---|
| Previous Owner | Rochin Feliciano | $161,435 | |
| Previous Owner | Bolanos Gladys P | $103,500 |
Source: Public Records
Tax History
| Year | Tax Paid | Tax Assessment Tax Assessment Total Assessment is a certain percentage of the fair market value that is determined by local assessors to be the total taxable value of land and additions on the property. | Land | Improvement |
|---|---|---|---|---|
| 2025 | $3,085 | $247,099 | $197,686 | $49,413 |
| 2024 | $3,085 | $242,255 | $193,810 | $48,445 |
| 2023 | $3,028 | $237,506 | $190,010 | $47,496 |
| 2022 | $2,890 | $232,850 | $186,285 | $46,565 |
| 2021 | $2,851 | $228,285 | $182,633 | $45,652 |
| 2019 | $2,767 | $221,516 | $177,217 | $44,299 |
| 2018 | $2,664 | $217,174 | $173,743 | $43,431 |
| 2016 | $2,537 | $208,744 | $166,998 | $41,746 |
| 2015 | $2,500 | $205,609 | $164,490 | $41,119 |
| 2014 | $2,516 | $201,582 | $161,268 | $40,314 |
Source: Public Records
Map
Nearby Homes
- 19531 Keswick St
- 19516 Blythe St
- 7554 Corbin Ave Unit 4
- 19828 Lull St
- 19844 Hemmingway St
- 19858 Saticoy St
- 19160 Ingomar St
- 7414 Quartz Ave
- 7514 Beckford Ave
- 7304 Corbin Ave Unit F
- 7308 Corbin Ave Unit G
- 7445 Oakdale Ave
- 7500 Lubao Ave
- 7240 Shirley Ave Unit 101
- 7508 Claire Ave
- 19545 Sherman Way Unit 47
- 19545 Sherman Way
- 19545 Sherman Way Unit 74
- 7535 Vanalden Ave
- 7309 Tampa Ave
- 19545 Keswick St
- 19538 Stagg St
- 19544 Stagg St
- 19530 Stagg St
- 19553 Keswick St
- 19525 Keswick St
- 19552 Stagg St
- 19524 Stagg St
- 19561 Keswick St
- 19517 Keswick St
- 19560 Stagg St
- 19516 Stagg St
- 19539 Stagg St
- 19545 Stagg St
- 19531 Stagg St
- 19553 Stagg St
- 19525 Stagg St
- 19509 Keswick St
- 19508 Stagg St
- 19561 Stagg St
Your Personal Tour Guide
Ask me questions while you tour the home.