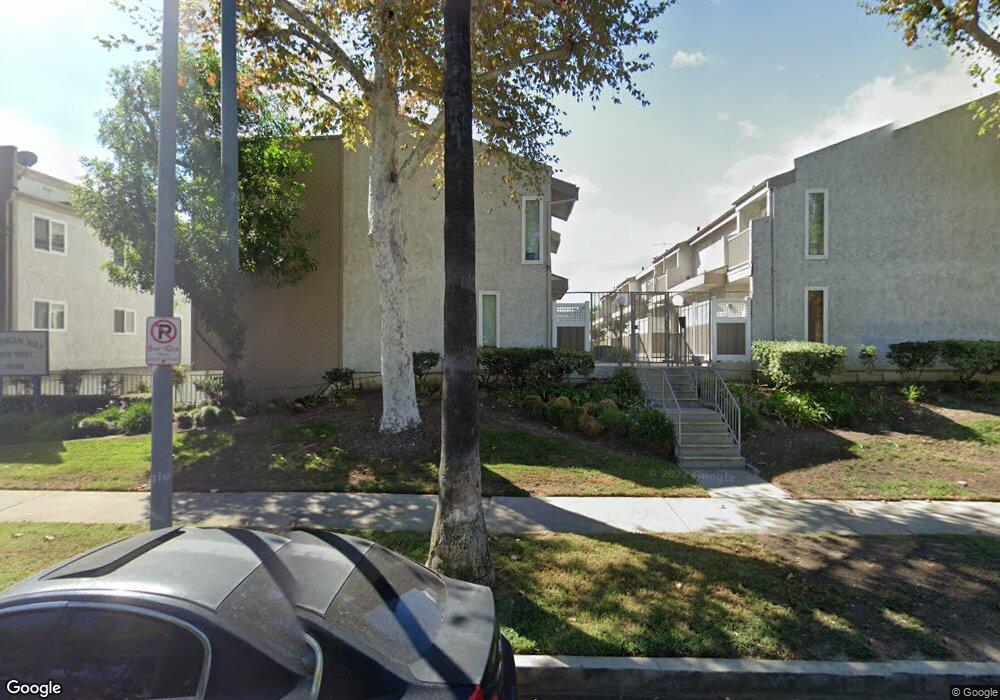
19540 Sherman Way Unit 106 Reseda, CA 91335
Estimated Value: $475,685 - $527,000
2
Beds
2
Baths
1,074
Sq Ft
$467/Sq Ft
Est. Value
About This Home
This home is located at 19540 Sherman Way Unit 106, Reseda, CA 91335 and is currently estimated at $501,421, approximately $466 per square foot. 19540 Sherman Way Unit 106 is a home located in Los Angeles County with nearby schools including Shirley Avenue Elementary School, John A. Sutter Middle School, and Ingenium Charter Middle School.
Ownership History
Date
Name
Owned For
Owner Type
Purchase Details
Closed on
May 13, 2023
Sold by
Osullivan Jean
Bought by
Jean Osullivan Living Trust
Current Estimated Value
Purchase Details
Closed on
Aug 23, 2009
Sold by
Williams Sharon
Bought by
Osullivan Jean
Home Financials for this Owner
Home Financials are based on the most recent Mortgage that was taken out on this home.
Original Mortgage
$171,830
Interest Rate
5%
Mortgage Type
FHA
Purchase Details
Closed on
May 6, 1999
Sold by
Williams Darrell
Bought by
Williams Sharon
Purchase Details
Closed on
Feb 19, 1999
Sold by
Montgomery William E and Montgomery Barbara R
Bought by
Williams Sharon
Home Financials for this Owner
Home Financials are based on the most recent Mortgage that was taken out on this home.
Original Mortgage
$117,180
Interest Rate
6.94%
Mortgage Type
FHA
Create a Home Valuation Report for This Property
The Home Valuation Report is an in-depth analysis detailing your home's value as well as a comparison with similar homes in the area
Home Values in the Area
Average Home Value in this Area
Purchase History
| Date | Buyer | Sale Price | Title Company |
|---|---|---|---|
| Jean Osullivan Living Trust | -- | None Listed On Document | |
| Osullivan Jean | $175,000 | Fidelity National Title | |
| Williams Sharon | -- | Investors Title Company | |
| Williams Sharon | $600,727 | Investors Title Company |
Source: Public Records
Mortgage History
| Date | Status | Borrower | Loan Amount |
|---|---|---|---|
| Previous Owner | Osullivan Jean | $171,830 | |
| Previous Owner | Williams Sharon | $117,180 |
Source: Public Records
Tax History Compared to Growth
Tax History
| Year | Tax Paid | Tax Assessment Tax Assessment Total Assessment is a certain percentage of the fair market value that is determined by local assessors to be the total taxable value of land and additions on the property. | Land | Improvement |
|---|---|---|---|---|
| 2025 | $2,740 | $225,879 | $45,171 | $180,708 |
| 2024 | $2,740 | $221,451 | $44,286 | $177,165 |
| 2023 | $2,688 | $217,110 | $43,418 | $173,692 |
| 2022 | $2,561 | $212,854 | $42,567 | $170,287 |
| 2021 | $2,524 | $208,682 | $41,733 | $166,949 |
| 2019 | $2,447 | $202,496 | $40,497 | $161,999 |
| 2018 | $2,417 | $198,526 | $39,703 | $158,823 |
| 2016 | $2,298 | $190,818 | $38,162 | $152,656 |
| 2015 | $2,264 | $187,952 | $37,589 | $150,363 |
| 2014 | $2,276 | $184,271 | $36,853 | $147,418 |
Source: Public Records
Map
Nearby Homes
- 19540 Sherman Way Unit 602
- 19545 Sherman Way Unit 44
- 19545 Sherman Way Unit 99
- 19545 Sherman Way Unit 74
- 19545 Sherman Way Unit 97
- 19545 Sherman Way Unit 66
- 19431 Sherman Way Unit 10
- 19431 Sherman Way Unit 24
- 19431 Sherman Way Unit 6
- 7304 Corbin Ave Unit F
- 7306 Jumilla Ave
- 19350 Sherman Way Unit 125
- 7420 Corbin Ave Unit 12
- 7430 Corbin Ave Unit 19
- 7331 1/2 Tampa Ave
- 7414 Quartz Ave
- 19230 Wyandotte St Unit 14
- 19832 Schoolcraft St
- 6900 Aura Ave
- 6800 Corbin Ave Unit 308
- 19540 Sherman Way Unit 105
- 19540 Sherman Way Unit 104
- 19540 Sherman Way Unit 103
- 19540 Sherman Way Unit 102
- 19540 Sherman Way Unit 101
- 19540 Sherman Way Unit 206
- 19540 Sherman Way Unit 205
- 19540 Sherman Way Unit 204
- 19540 Sherman Way Unit 203
- 19540 Sherman Way Unit 202
- 19540 Sherman Way Unit 201
- 19540 Sherman Way Unit 305
- 19540 Sherman Way Unit 304
- 19540 Sherman Way Unit 303
- 19540 Sherman Way Unit 302
- 19540 Sherman Way Unit 301
- 19540 Sherman Way Unit 405
- 19540 Sherman Way Unit 404
- 19540 Sherman Way Unit 403
- 19540 Sherman Way Unit 402