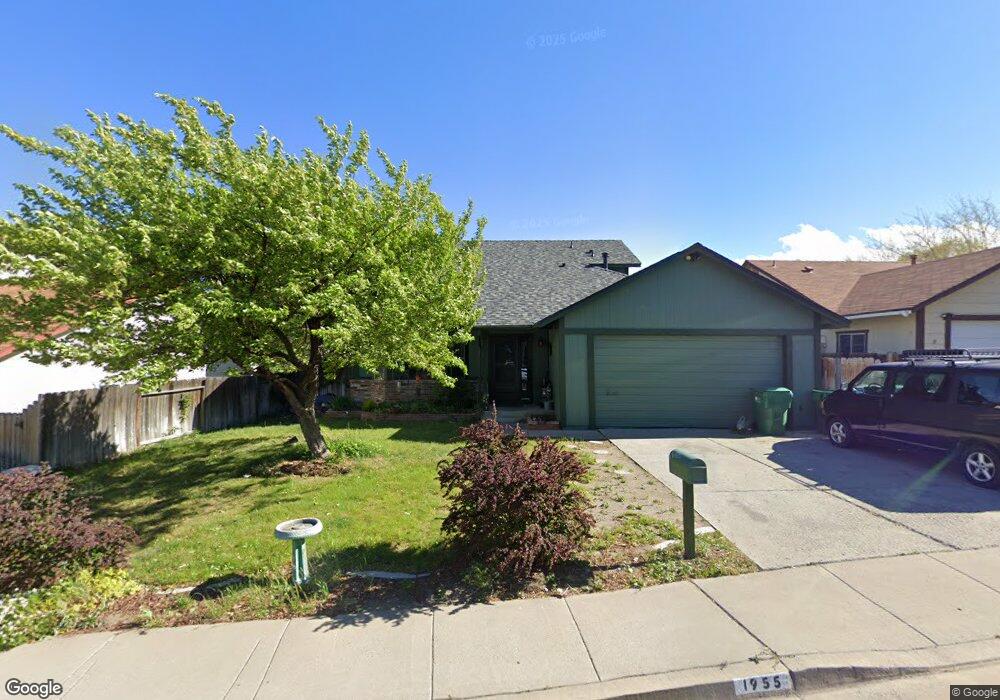
1955 Peavine Rd Reno, NV 89503
Kings Row NeighborhoodEstimated Value: $510,000 - $523,000
3
Beds
3
Baths
1,343
Sq Ft
$384/Sq Ft
Est. Value
About This Home
This home is located at 1955 Peavine Rd, Reno, NV 89503 and is currently estimated at $515,811, approximately $384 per square foot. 1955 Peavine Rd is a home located in Washoe County with nearby schools including Peavine Elementary School, Archie Clayton Pre-AP Academy, and Reno High School.
Ownership History
Date
Name
Owned For
Owner Type
Purchase Details
Closed on
Sep 19, 2003
Sold by
Hoover Jon C
Bought by
Banas Steven Guy and Banas Melissa A
Current Estimated Value
Home Financials for this Owner
Home Financials are based on the most recent Mortgage that was taken out on this home.
Original Mortgage
$164,000
Outstanding Balance
$75,713
Interest Rate
6.17%
Mortgage Type
Unknown
Estimated Equity
$440,098
Purchase Details
Closed on
Aug 1, 2002
Sold by
Platt Marcus J and Cordes Gregory A
Bought by
Belcher Todd and Lockett Rose C
Home Financials for this Owner
Home Financials are based on the most recent Mortgage that was taken out on this home.
Original Mortgage
$154,472
Interest Rate
6.43%
Mortgage Type
FHA
Purchase Details
Closed on
Nov 11, 1994
Sold by
Dolan Joseph R and Dolan Patricia
Bought by
Hoover Jon C
Home Financials for this Owner
Home Financials are based on the most recent Mortgage that was taken out on this home.
Original Mortgage
$98,800
Interest Rate
8.5%
Create a Home Valuation Report for This Property
The Home Valuation Report is an in-depth analysis detailing your home's value as well as a comparison with similar homes in the area
Home Values in the Area
Average Home Value in this Area
Purchase History
| Date | Buyer | Sale Price | Title Company |
|---|---|---|---|
| Banas Steven Guy | $205,000 | Stewart Title Of Northern Nv | |
| Belcher Todd | $156,900 | First American Title | |
| Hoover Jon C | $123,500 | Stewart Title |
Source: Public Records
Mortgage History
| Date | Status | Borrower | Loan Amount |
|---|---|---|---|
| Open | Banas Steven Guy | $164,000 | |
| Previous Owner | Belcher Todd | $154,472 | |
| Previous Owner | Hoover Jon C | $98,800 | |
| Closed | Banas Steven Guy | $20,500 |
Source: Public Records
Tax History Compared to Growth
Tax History
| Year | Tax Paid | Tax Assessment Tax Assessment Total Assessment is a certain percentage of the fair market value that is determined by local assessors to be the total taxable value of land and additions on the property. | Land | Improvement |
|---|---|---|---|---|
| 2025 | $1,753 | $73,605 | $39,734 | $33,872 |
| 2024 | $1,753 | $71,084 | $36,475 | $34,609 |
| 2023 | $1,702 | $70,820 | $37,639 | $33,181 |
| 2022 | $1,654 | $58,195 | $30,258 | $27,938 |
| 2021 | $1,612 | $50,473 | $22,344 | $28,129 |
| 2020 | $1,560 | $50,922 | $22,444 | $28,478 |
| 2019 | $1,513 | $49,633 | $21,812 | $27,821 |
| 2018 | $1,469 | $42,874 | $15,428 | $27,446 |
| 2017 | $1,426 | $43,148 | $15,428 | $27,720 |
| 2016 | $1,389 | $42,564 | $13,998 | $28,566 |
| 2015 | $1,792 | $41,313 | $12,336 | $28,977 |
| 2014 | $1,349 | $37,483 | $9,443 | $28,040 |
| 2013 | -- | $35,560 | $7,714 | $27,846 |
Source: Public Records
Map
Nearby Homes
- 3190 Cartwright Rd
- 1535 Van Ness Ave
- 2920 Harding Cir
- 1935 Marlette Ave
- 2815 Severn Dr
- 1835 Marlette Ave
- 2645 Emily St
- 2120 Keystone Ave
- 3201 Green River Dr
- 3160 Sky Country Dr
- 1845 Wesley Dr
- 3181 Sky Country Dr
- 1765 Harold Dr
- 3435 Balboa Dr
- 1516 Coleman Dr
- 1455 Exeter Way
- 3520 Balboa Dr
- 1540 King Edward Dr
- 1702 Grandview Ave
- 3235 Bryan St
- 1965 Peavine Rd
- 1935 Peavine Rd
- 2405 Durango Ct
- 1915 Peavine Rd
- 1975 Peavine Rd
- 2415 Durango Ct
- 2400 Durango Ct
- 1895 Peavine Rd
- 1950 Peavine Rd
- 1990 Peavine Rd
- 1995 Peavine Rd
- 2680 Keystone Ave
- 1920 Peavine Rd
- 1865 Peavine Rd Unit 2
- 2660 Keystone Ave
- 2910 Keystone Ave
- 2410 Durango Ct
- 1900 Peavine Rd
- 2920 Keystone Ave Unit 2
- 2420 Durango Ct