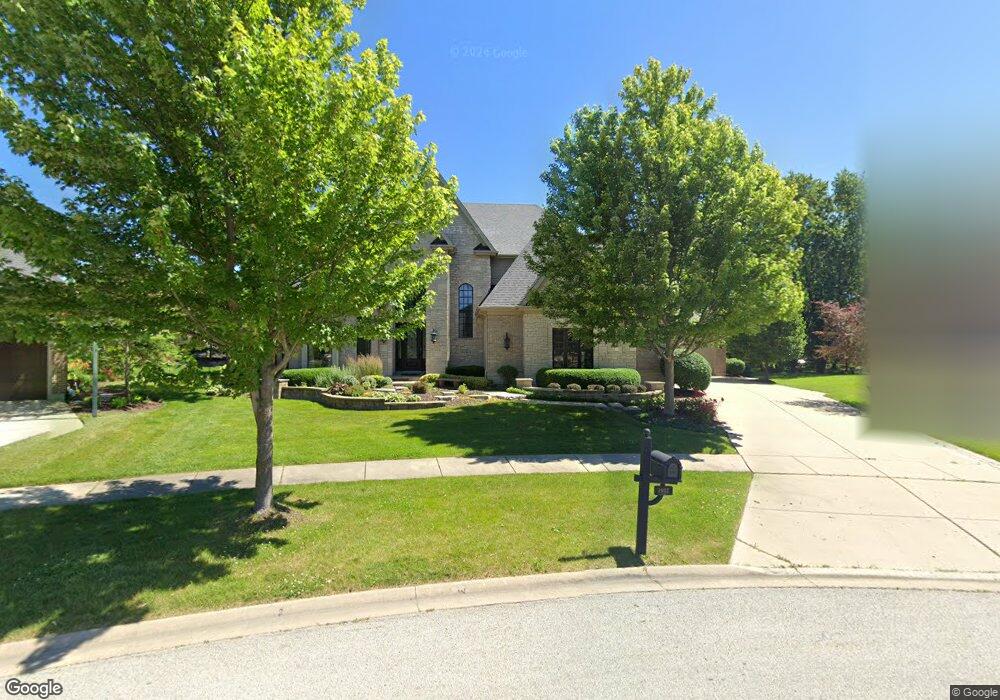
1955 Saddle Farm Ln Naperville, IL 60564
Springbrook Prairie NeighborhoodEstimated Value: $1,029,000 - $1,721,000
Studio
1
Bath
26,005
Sq Ft
$56/Sq Ft
Est. Value
About This Home
This home is located at 1955 Saddle Farm Ln, Naperville, IL 60564 and is currently estimated at $1,466,153, approximately $56 per square foot. 1955 Saddle Farm Ln is a home located in Will County with nearby schools including Robert Clow Elementary School, Gordon Gregory Middle School, and Neuqua Valley High School.
Ownership History
Date
Name
Owned For
Owner Type
Purchase Details
Closed on
Feb 27, 2012
Sold by
Peterson Stephen P and Peterson Carol R
Bought by
Peterson Stephen P and Peterson Carol R
Current Estimated Value
Purchase Details
Closed on
Nov 30, 2007
Sold by
Stefani & Sons Development Co Inc
Bought by
Peterson Stephen P and Peterson Carol R
Home Financials for this Owner
Home Financials are based on the most recent Mortgage that was taken out on this home.
Original Mortgage
$700,000
Outstanding Balance
$441,924
Interest Rate
6.25%
Mortgage Type
Purchase Money Mortgage
Estimated Equity
$1,024,229
Purchase Details
Closed on
Mar 6, 2007
Sold by
Oliver Hoffman Corp
Bought by
Stefani & Sons Development Co Inc
Create a Home Valuation Report for This Property
The Home Valuation Report is an in-depth analysis detailing your home's value as well as a comparison with similar homes in the area
Home Values in the Area
Average Home Value in this Area
Purchase History
| Date | Buyer | Sale Price | Title Company |
|---|---|---|---|
| Peterson Stephen P | -- | None Available | |
| Peterson Stephen P | $1,278,500 | Ctic | |
| Stefani & Sons Development Co Inc | $353,000 | Chicago Title Insurance Co |
Source: Public Records
Mortgage History
| Date | Status | Borrower | Loan Amount |
|---|---|---|---|
| Open | Peterson Stephen P | $700,000 |
Source: Public Records
Tax History
| Year | Tax Paid | Tax Assessment Tax Assessment Total Assessment is a certain percentage of the fair market value that is determined by local assessors to be the total taxable value of land and additions on the property. | Land | Improvement |
|---|---|---|---|---|
| 2024 | $31,225 | $492,720 | $71,814 | $420,906 |
| 2023 | $31,225 | $435,265 | $63,440 | $371,825 |
| 2022 | $28,098 | $398,813 | $60,013 | $338,800 |
| 2021 | $26,865 | $379,822 | $57,155 | $322,667 |
| 2020 | $26,358 | $373,803 | $56,249 | $317,554 |
| 2019 | $25,912 | $363,268 | $54,664 | $308,604 |
| 2018 | $24,750 | $341,391 | $53,461 | $287,930 |
| 2017 | $24,376 | $332,578 | $52,081 | $280,497 |
| 2016 | $24,334 | $338,436 | $50,960 | $287,476 |
| 2015 | $25,101 | $325,419 | $49,000 | $276,419 |
| 2014 | $25,101 | $316,142 | $49,000 | $267,142 |
| 2013 | $25,101 | $316,142 | $49,000 | $267,142 |
Source: Public Records
Map
Nearby Homes
- 2240 Mecan Dr
- 28W587 Leverenz Rd
- 1329 Neskola Ct
- 28W555 Leverenz Rd
- 2413 Flambeau Dr
- 2311 Leverenz Rd
- 2552 Dewes Ln
- 2503 Skylane Dr
- 2828 Bluewater Cir
- 2725 Springdale Cir
- 1137 Crimson Ct
- 1860 Tamahawk Ln
- 2939 Brossman St
- 2627 Homestead Dr
- 2423 Durango Ln
- 911 Rock Spring Rd
- 9S321 Chandelle Dr
- 3111 Landore Dr
- 2835 Rutland Cir Unit 202
- 2809 Alameda Ct
- 1959 Saddle Farm Ln
- 1951 Saddle Farm Ln
- 10S076 Alago Rd
- 1963 Saddle Farm Ln
- 1947 Saddle Farm Ln
- 10S090 Alago Rd
- 10S104 Alago Rd
- 1948 Saddle Farm Ln
- 10S060 Alago Rd
- 1967 Saddle Farm Ln
- 1943 Saddle Farm Ln
- 10S120 Alago Rd
- 1964 Saddle Farm Ln
- 1960 Saddle Farm Ln
- 10S044 Alago Rd
- 1936 Saddle Farm Ln
- 10S136 Alago Rd
- 10S089 Alago Rd
- 1971 Saddle Farm Ln
Your Personal Tour Guide
Ask me questions while you tour the home.