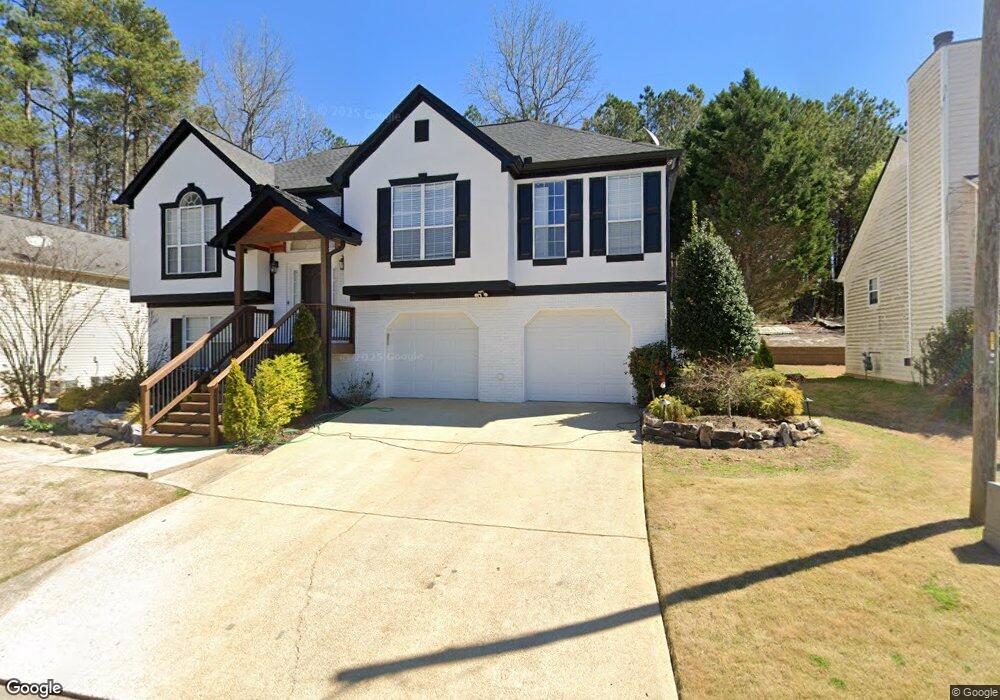
1955 Stonecrest Ct Austell, GA 30106
Estimated Value: $349,000 - $360,000
5
Beds
3
Baths
1,570
Sq Ft
$226/Sq Ft
Est. Value
About This Home
This home is located at 1955 Stonecrest Ct, Austell, GA 30106 and is currently estimated at $354,223, approximately $225 per square foot. 1955 Stonecrest Ct is a home located in Cobb County with nearby schools including Deerwood Elementary School, Clarkdale Elementary School, and Garrett Middle School.
Ownership History
Date
Name
Owned For
Owner Type
Purchase Details
Closed on
Jun 17, 2008
Sold by
Cervantes Roxanna
Bought by
Cervantes Roxanna and Chavez Nelsonel
Current Estimated Value
Purchase Details
Closed on
May 31, 2007
Sold by
Robinson Daryle L and Robinson Shelia D
Bought by
Cervantes Roxanna
Home Financials for this Owner
Home Financials are based on the most recent Mortgage that was taken out on this home.
Original Mortgage
$173,000
Interest Rate
6.16%
Mortgage Type
New Conventional
Purchase Details
Closed on
Jun 1, 2005
Sold by
W & H Properties Llc
Bought by
Stonecrest Hoa Inc
Purchase Details
Closed on
Nov 29, 2000
Sold by
W & H Properties Llc
Bought by
Robinson Daryle L and Robinson Sheila D
Home Financials for this Owner
Home Financials are based on the most recent Mortgage that was taken out on this home.
Original Mortgage
$163,098
Interest Rate
7.02%
Mortgage Type
VA
Create a Home Valuation Report for This Property
The Home Valuation Report is an in-depth analysis detailing your home's value as well as a comparison with similar homes in the area
Home Values in the Area
Average Home Value in this Area
Purchase History
| Date | Buyer | Sale Price | Title Company |
|---|---|---|---|
| Cervantes Roxanna | -- | -- | |
| Cervantes Roxanna | $193,000 | -- | |
| Stonecrest Hoa Inc | $1,000 | -- | |
| Robinson Daryle L | $159,900 | -- |
Source: Public Records
Mortgage History
| Date | Status | Borrower | Loan Amount |
|---|---|---|---|
| Previous Owner | Cervantes Roxanna | $173,000 | |
| Previous Owner | Robinson Daryle L | $163,098 |
Source: Public Records
Tax History Compared to Growth
Tax History
| Year | Tax Paid | Tax Assessment Tax Assessment Total Assessment is a certain percentage of the fair market value that is determined by local assessors to be the total taxable value of land and additions on the property. | Land | Improvement |
|---|---|---|---|---|
| 2025 | $3,529 | $148,824 | $36,000 | $112,824 |
| 2024 | $3,538 | $149,080 | $34,000 | $115,080 |
| 2023 | $2,290 | $116,564 | $20,000 | $96,564 |
| 2022 | $2,854 | $116,564 | $20,000 | $96,564 |
| 2021 | $2,181 | $85,828 | $14,000 | $71,828 |
| 2020 | $1,973 | $76,300 | $14,000 | $62,300 |
| 2019 | $1,973 | $76,300 | $14,000 | $62,300 |
| 2018 | $1,615 | $62,236 | $14,000 | $48,236 |
| 2017 | $1,383 | $57,032 | $12,000 | $45,032 |
| 2016 | $1,384 | $57,032 | $12,000 | $45,032 |
| 2015 | $849 | $37,648 | $8,800 | $28,848 |
| 2014 | $856 | $37,648 | $0 | $0 |
Source: Public Records
Map
Nearby Homes
- 1959 Stonecrest Ct
- 1951 Stonecrest Ct
- 1963 Stonecrest Ct
- 1962 Stonecrest Ct Unit 31
- 1962 Stonecrest Ct
- 1954 Stonecrest Ct
- 1967 Stonecrest Ct
- 1950 Stonecrest Ct
- 1970 Stonecrest Ct
- 1971 Stonecrest Ct
- 1975 Stonecrest Ct
- 4373 Stonecrest Dr
- 4361 Stonecrest Dr
- 4369 Stonecrest Dr
- 4365 Stonecrest Dr
- 1979 Stonecrest Ct
- 4356 Kousa Rd Unit 5
- 4356 Kousa Rd Unit 21
- 4356 Kousa Rd Unit 4356
- 4358 Kousa Rd Unit 5