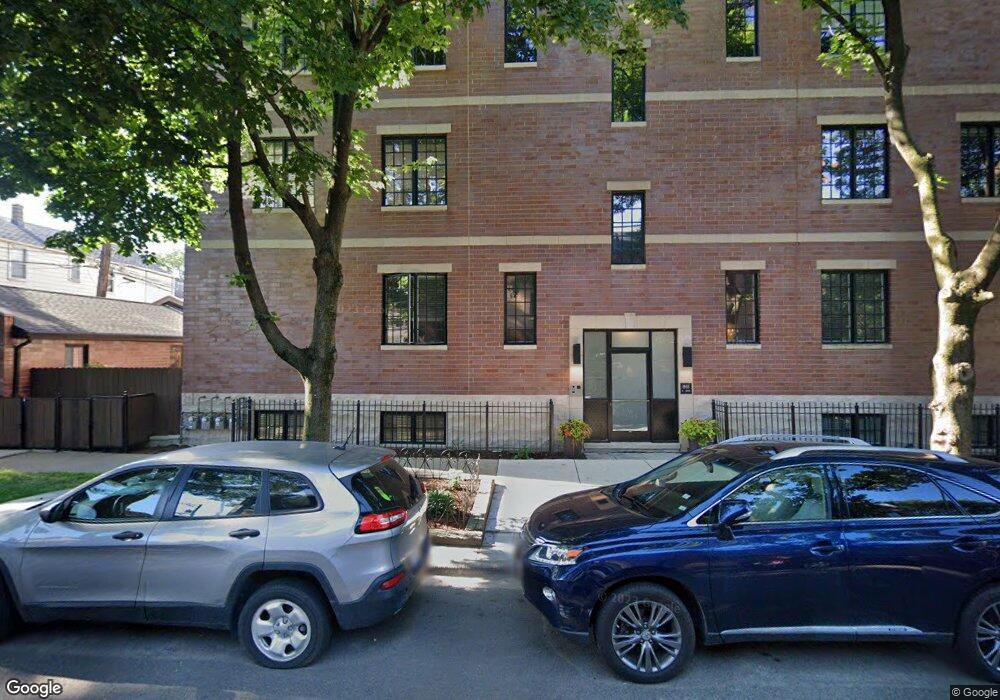
1955 W Barry Ave Unit P1 Chicago, IL 60657
Roscoe Village NeighborhoodEstimated Value: $182,000
--
Bed
--
Bath
7,040
Sq Ft
$26/Sq Ft
Est. Value
About This Home
This home is located at 1955 W Barry Ave Unit P1, Chicago, IL 60657 and is currently estimated at $182,000, approximately $25 per square foot. 1955 W Barry Ave Unit P1 is a home located in Cook County with nearby schools including Jahn School of Fine Arts, Lake View High School, and Saint Luke Academy.
Ownership History
Date
Name
Owned For
Owner Type
Purchase Details
Closed on
Jun 21, 2023
Sold by
Weinberg Jane and Weinberg Chamila
Bought by
Williams Douglas and Blezinger Jensen
Current Estimated Value
Home Financials for this Owner
Home Financials are based on the most recent Mortgage that was taken out on this home.
Original Mortgage
$688,500
Outstanding Balance
$665,439
Interest Rate
5.13%
Mortgage Type
New Conventional
Estimated Equity
-$483,439
Purchase Details
Closed on
Sep 16, 2016
Sold by
Hyde Ryan and Hyde Emily
Bought by
Weinberg Jane
Purchase Details
Closed on
Jul 11, 2013
Sold by
Kulberg Scott and Kulberg Stefanie
Bought by
Hyde Ryan and Hyde Emily
Home Financials for this Owner
Home Financials are based on the most recent Mortgage that was taken out on this home.
Original Mortgage
$408,750
Interest Rate
4.53%
Mortgage Type
New Conventional
Create a Home Valuation Report for This Property
The Home Valuation Report is an in-depth analysis detailing your home's value as well as a comparison with similar homes in the area
Home Values in the Area
Average Home Value in this Area
Purchase History
| Date | Buyer | Sale Price | Title Company |
|---|---|---|---|
| Williams Douglas | $810,000 | None Listed On Document | |
| Weinberg Jane | $607,000 | Chicago Title | |
| Hyde Ryan | $545,000 | Fidelity National Title |
Source: Public Records
Mortgage History
| Date | Status | Borrower | Loan Amount |
|---|---|---|---|
| Open | Williams Douglas | $688,500 | |
| Previous Owner | Hyde Ryan | $408,750 |
Source: Public Records
Tax History Compared to Growth
Tax History
| Year | Tax Paid | Tax Assessment Tax Assessment Total Assessment is a certain percentage of the fair market value that is determined by local assessors to be the total taxable value of land and additions on the property. | Land | Improvement |
|---|---|---|---|---|
| 2024 | $422 | $2,677 | $641 | $2,036 |
| 2023 | $411 | $2,000 | $517 | $1,483 |
| 2022 | $411 | $2,000 | $517 | $1,483 |
| 2021 | $402 | $1,999 | $516 | $1,483 |
| 2020 | $467 | $2,097 | $231 | $1,866 |
| 2019 | $459 | $2,286 | $231 | $2,055 |
| 2018 | $452 | $2,286 | $231 | $2,055 |
| 2017 | $412 | $1,914 | $206 | $1,708 |
| 2016 | $383 | $1,914 | $206 | $1,708 |
| 2015 | $351 | $1,914 | $206 | $1,708 |
| 2014 | $307 | $1,652 | $168 | $1,484 |
| 2013 | $300 | $1,652 | $168 | $1,484 |
Source: Public Records
Map
Nearby Homes
- 2020 W Barry Ave
- 3009 N Damen Ave Unit 2
- 1935 W Belmont Ave Unit 2
- 2011 W Belmont Ave Unit 208
- 2027 W Belmont Ave Unit 1
- 1938 W Belmont Ave Unit 2
- 2941 N Damen Ave Unit 2
- 3137 N Hoyne Ave
- 3040 N Hoyne Ave
- 1955 W Melrose St Unit 2
- 3002 N Hoyne Ave
- 3015 N Hamilton Ave
- 2034 W Melrose St
- 2910 N Seeley Ave
- 2915 N Clybourn Ave Unit 310
- 2902 N Seeley Ave
- 2933 N Clybourn Ave Unit 204
- 2903 N Wolcott Ave Unit A
- 1759 W Wellington Ave
- 2140 W Belmont Ave Unit 1
- 1955 W Barry Ave Unit 1E
- 1955 W Barry Ave Unit 2E
- 1955 W Barry Ave Unit 1W
- 1955 W Barry Ave Unit 2W
- 1955 W Barry Ave Unit P4
- 1955 W Barry Ave Unit P2
- 1955 W Barry Ave Unit P3
- 3055 N Damen Ave
- 3053 N Damen Ave
- 1952 W Barry Ave
- 1943 W Barry Ave Unit 1
- 3049 N Damen Ave
- 1956 W Barry Ave
- 1954 W Barry Ave
- 3101 N Damen Ave
- 3047 N Damen Ave
- 1941 W Barry Ave
- 3105 N Damen Ave
- 3105 N Damen Ave Unit 2N
- 3105 N Damen Ave Unit 1N