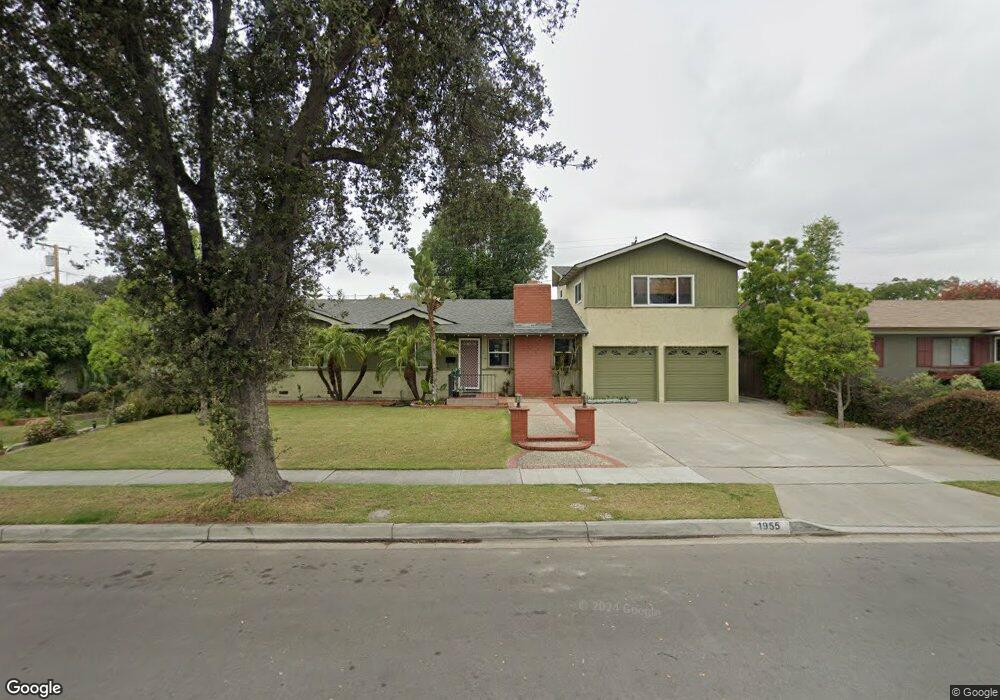
1955 W Lullaby Ln Anaheim, CA 92804
West Anaheim NeighborhoodEstimated Value: $1,016,000 - $1,275,000
5
Beds
3
Baths
2,322
Sq Ft
$500/Sq Ft
Est. Value
About This Home
This home is located at 1955 W Lullaby Ln, Anaheim, CA 92804 and is currently estimated at $1,161,088, approximately $500 per square foot. 1955 W Lullaby Ln is a home located in Orange County with nearby schools including James Madison Elementary School, Ball Junior High School, and Loara High School.
Ownership History
Date
Name
Owned For
Owner Type
Purchase Details
Closed on
Oct 5, 2023
Sold by
Deleon Maricel
Bought by
Maricel P De Leon Trust and De Leon
Current Estimated Value
Purchase Details
Closed on
Nov 2, 1999
Sold by
Michelle Deleon
Bought by
Deleon Maricel
Home Financials for this Owner
Home Financials are based on the most recent Mortgage that was taken out on this home.
Original Mortgage
$165,000
Interest Rate
6.87%
Mortgage Type
Purchase Money Mortgage
Purchase Details
Closed on
Mar 24, 1997
Sold by
Federal Home Loan Mortgage Corporation
Bought by
Deleon Marciel and Deleon Michelle
Home Financials for this Owner
Home Financials are based on the most recent Mortgage that was taken out on this home.
Original Mortgage
$165,300
Interest Rate
7.63%
Purchase Details
Closed on
Nov 1, 1996
Sold by
Khe Nguyen and Son Ngo Son
Bought by
First Nationwide Mtg Corp
Purchase Details
Closed on
Mar 4, 1996
Sold by
Ngo Son
Bought by
Nguyen Khe
Create a Home Valuation Report for This Property
The Home Valuation Report is an in-depth analysis detailing your home's value as well as a comparison with similar homes in the area
Home Values in the Area
Average Home Value in this Area
Purchase History
| Date | Buyer | Sale Price | Title Company |
|---|---|---|---|
| Maricel P De Leon Trust | -- | None Listed On Document | |
| Deleon Maricel | -- | Old Republic Title Company | |
| Deleon Marciel | $174,000 | Orange Coast Title | |
| First Nationwide Mtg Corp | $165,000 | Continental Lawyers Title Co | |
| Nguyen Khe | -- | -- |
Source: Public Records
Mortgage History
| Date | Status | Borrower | Loan Amount |
|---|---|---|---|
| Previous Owner | Deleon Maricel | $165,000 | |
| Previous Owner | Deleon Marciel | $165,300 |
Source: Public Records
Tax History Compared to Growth
Tax History
| Year | Tax Paid | Tax Assessment Tax Assessment Total Assessment is a certain percentage of the fair market value that is determined by local assessors to be the total taxable value of land and additions on the property. | Land | Improvement |
|---|---|---|---|---|
| 2025 | $4,089 | $343,227 | $183,979 | $159,248 |
| 2024 | $4,089 | $336,498 | $180,372 | $156,126 |
| 2023 | $4,002 | $329,900 | $176,835 | $153,065 |
| 2022 | $3,950 | $323,432 | $173,368 | $150,064 |
| 2021 | $3,955 | $317,091 | $169,969 | $147,122 |
| 2020 | $3,939 | $313,840 | $168,226 | $145,614 |
| 2019 | $3,824 | $307,687 | $164,928 | $142,759 |
| 2018 | $3,746 | $301,654 | $161,694 | $139,960 |
| 2017 | $3,601 | $295,740 | $158,524 | $137,216 |
| 2016 | $3,590 | $289,942 | $155,416 | $134,526 |
| 2015 | $3,558 | $285,587 | $153,081 | $132,506 |
| 2014 | $3,342 | $279,993 | $150,082 | $129,911 |
Source: Public Records
Map
Nearby Homes
- 1944 W Lullaby Ln
- 1350 S Ashington Ln
- 1250 S Brookhurst St Unit 1059
- 1250 S Brookhurst St Unit 2028
- 1250 S Brookhurst St Unit 2080
- 1250 S Brookhurst St
- 1250 S Brookhurst St Unit 2033
- 2011 W Katella Ave Unit 61
- 1737 S Garden Dr
- 10301 Antigua St
- 930 S Emerald St
- 1700 W Cerritos Ave Unit 216
- 10301 Rhiems Rd
- 1913 W Beacon Ave
- 10112 Becca Dr
- 1765 S Biscayne Ct
- 994 S Sutter Creek Rd Unit 60
- 1768 W Juno Ave
- 938 S Sutter Creek Rd Unit 54
- 10622 Tibbs Cir
- 1959 W Lullaby Ln
- 1949 W Lullaby Ln
- 1952 W Harriet Ln
- 1958 W Harriet Ln
- 1948 W Harriet Ln
- 1965 W Lullaby Ln
- 1945 W Lullaby Ln
- 1954 W Lullaby Ln
- 1962 W Harriet Ln
- 1950 W Lullaby Ln
- 1958 W Lullaby Ln
- 1942 W Harriet Ln
- 1941 W Lullaby Ln
- 1969 W Lullaby Ln
- 1964 W Lullaby Ln
- 1968 W Harriet Ln
- 1938 W Harriet Ln
- 1953 W Harriet Ln
- 1955 W Cerritos Ave
- 1959 W Harriet Ln