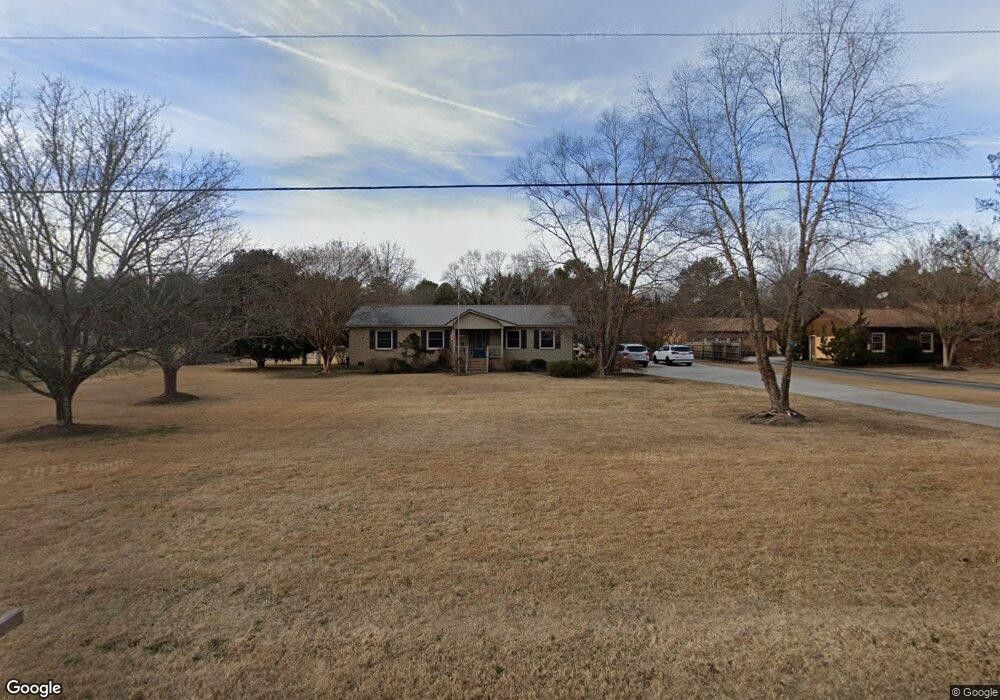
1956 Faulkner Rd Clover, SC 29710
Estimated Value: $272,223 - $450,000
--
Bed
--
Bath
1,475
Sq Ft
$238/Sq Ft
Est. Value
About This Home
This home is located at 1956 Faulkner Rd, Clover, SC 29710 and is currently estimated at $351,556, approximately $238 per square foot. 1956 Faulkner Rd is a home located in York County with nearby schools including Bethany Elementary School, Clover Middle School, and Clover High School.
Ownership History
Date
Name
Owned For
Owner Type
Purchase Details
Closed on
Feb 5, 2025
Sold by
Klyn John Willem and Klyn Jan Willem
Bought by
Klyn Jan Willem and Klyn Rose Ann
Current Estimated Value
Purchase Details
Closed on
Oct 29, 2024
Sold by
Klyn Sandra Watson
Bought by
Klyn Jan Willem
Purchase Details
Closed on
Apr 28, 2011
Sold by
Eddins Jon Vernon
Bought by
Klyn Jan Willem and Klyn Sandra W
Home Financials for this Owner
Home Financials are based on the most recent Mortgage that was taken out on this home.
Original Mortgage
$146,197
Interest Rate
4.83%
Mortgage Type
FHA
Create a Home Valuation Report for This Property
The Home Valuation Report is an in-depth analysis detailing your home's value as well as a comparison with similar homes in the area
Home Values in the Area
Average Home Value in this Area
Purchase History
| Date | Buyer | Sale Price | Title Company |
|---|---|---|---|
| Klyn Jan Willem | -- | None Listed On Document | |
| Klyn Jan Willem | -- | None Listed On Document | |
| Klyn Jan Willem | -- | None Listed On Document | |
| Klyn Jan Willem | -- | None Listed On Document | |
| Klyn Jan Willem | $150,000 | -- |
Source: Public Records
Mortgage History
| Date | Status | Borrower | Loan Amount |
|---|---|---|---|
| Previous Owner | Klyn Jan Willem | $146,197 |
Source: Public Records
Tax History Compared to Growth
Tax History
| Year | Tax Paid | Tax Assessment Tax Assessment Total Assessment is a certain percentage of the fair market value that is determined by local assessors to be the total taxable value of land and additions on the property. | Land | Improvement |
|---|---|---|---|---|
| 2025 | $373 | $4,972 | $1,039 | $3,933 |
| 2024 | $301 | $4,324 | $647 | $3,677 |
| 2023 | $309 | $4,324 | $647 | $3,677 |
| 2022 | $250 | $4,324 | $647 | $3,677 |
| 2021 | -- | $4,324 | $647 | $3,677 |
| 2020 | $246 | $4,324 | $0 | $0 |
| 2019 | $204 | $3,760 | $0 | $0 |
| 2018 | $206 | $3,760 | $0 | $0 |
| 2017 | $191 | $3,760 | $0 | $0 |
| 2016 | $187 | $3,760 | $0 | $0 |
| 2014 | $233 | $3,760 | $880 | $2,880 |
| 2013 | $233 | $5,520 | $880 | $4,640 |
Source: Public Records
Map
Nearby Homes
- 0000 Davis Cir
- 1240 Beamguard Rd
- 1975 Kehl Rd
- 1698 Highway 161 S
- 966 Laurelwood Dr
- 395 Lone Tree Ln
- 946 Laurelwood Dr
- 2180 Lawrence Rd
- 534 Pennyfields Ln
- 582 King Clover Ln
- 616 Plowshare Way Unit 35
- 1312 Sage Pine Cir Unit 19
- 332 Triple Ponds Ct Unit 22
- 542 King Clover Ln
- 132 Oak St
- 229 Price St
- 1526 Glenbar Ct
- Pinehurst with 3rd Floor Retreat Plan at Edmunds Farm
- Madison Plan at Edmunds Farm
- Southport Plan at Edmunds Farm
- 1944 Faulkner Rd
- 1968 Faulkner Rd
- 1932 Faulkner Rd
- 1941 Faulkner Rd
- 1980 Faulkner Rd
- 1920 Faulkner Rd
- 1992 Faulkner Rd
- Lot 25 Davis Cir
- 1989 Faulkner Rd
- 1827 Davis Cir
- 1808 Davis Cir
- 1973 Davis Cir
- 1925 Davis Cir
- 1925 Davis Cir
- 1961 Davis Cir
- 1961 Davis Cir Unit 15
- 1820 Davis Cir
- 1949 Davis Cir
- 1949 Davis Cir Unit 14
- 1937 Davis Cir