19561 Pompano Ln Unit 101 Huntington Beach, CA 92648
Estimated Value: $1,274,000 - $1,427,000
4
Beds
4
Baths
2,475
Sq Ft
$553/Sq Ft
Est. Value
About This Home
This home is located at 19561 Pompano Ln Unit 101, Huntington Beach, CA 92648 and is currently estimated at $1,369,189, approximately $553 per square foot. 19561 Pompano Ln Unit 101 is a home located in Orange County with nearby schools including Ethel Dwyer Middle, Huntington Beach High School, and Kinetic Academy.
Ownership History
Date
Name
Owned For
Owner Type
Purchase Details
Closed on
Oct 8, 2008
Sold by
Rochester Michael J and Rochester Yvonne C
Bought by
Rochester Michael Jerome and Rochester Yvonne Caroline
Current Estimated Value
Purchase Details
Closed on
Sep 19, 2008
Sold by
Moynihan Niall and Moynihan Karen
Bought by
Rochester Michael J and Rochester Yvonne C
Purchase Details
Closed on
Nov 8, 2003
Sold by
Moynihan Niall and Moynihan Karen
Bought by
Moynihan Niali and Moynihan Karen
Purchase Details
Closed on
Feb 4, 2000
Sold by
Baugh Coy F and Baugh Cheryl A
Bought by
Moynihan Niall J and Moynihan Karen
Home Financials for this Owner
Home Financials are based on the most recent Mortgage that was taken out on this home.
Original Mortgage
$308,000
Interest Rate
8%
Purchase Details
Closed on
Jul 15, 1998
Sold by
Baugh Coy F and Baugh Cheryl A
Bought by
Baugh Coy F and Baugh Cheryl A
Create a Home Valuation Report for This Property
The Home Valuation Report is an in-depth analysis detailing your home's value as well as a comparison with similar homes in the area
Home Values in the Area
Average Home Value in this Area
Purchase History
| Date | Buyer | Sale Price | Title Company |
|---|---|---|---|
| Rochester Michael Jerome | -- | None Available | |
| Rochester Michael J | $670,000 | Landamerica Southland Title | |
| Moynihan Niali | -- | -- | |
| Moynihan Niall J | $385,000 | Fidelity National Title Co | |
| Baugh Coy F | -- | -- |
Source: Public Records
Mortgage History
| Date | Status | Borrower | Loan Amount |
|---|---|---|---|
| Previous Owner | Moynihan Niall J | $308,000 |
Source: Public Records
Tax History Compared to Growth
Tax History
| Year | Tax Paid | Tax Assessment Tax Assessment Total Assessment is a certain percentage of the fair market value that is determined by local assessors to be the total taxable value of land and additions on the property. | Land | Improvement |
|---|---|---|---|---|
| 2025 | $6,887 | $608,477 | $95,911 | $512,566 |
| 2024 | $6,887 | $596,547 | $94,031 | $502,516 |
| 2023 | $6,731 | $584,850 | $92,187 | $492,663 |
| 2022 | $6,553 | $573,383 | $90,380 | $483,003 |
| 2021 | $6,431 | $562,141 | $88,608 | $473,533 |
| 2020 | $6,388 | $556,377 | $87,699 | $468,678 |
| 2019 | $6,312 | $545,468 | $85,979 | $459,489 |
| 2018 | $6,214 | $534,773 | $84,293 | $450,480 |
| 2017 | $6,130 | $524,288 | $82,640 | $441,648 |
| 2016 | $5,859 | $514,008 | $81,019 | $432,989 |
| 2015 | $5,802 | $506,288 | $79,802 | $426,486 |
| 2014 | $5,680 | $496,371 | $78,239 | $418,132 |
Source: Public Records
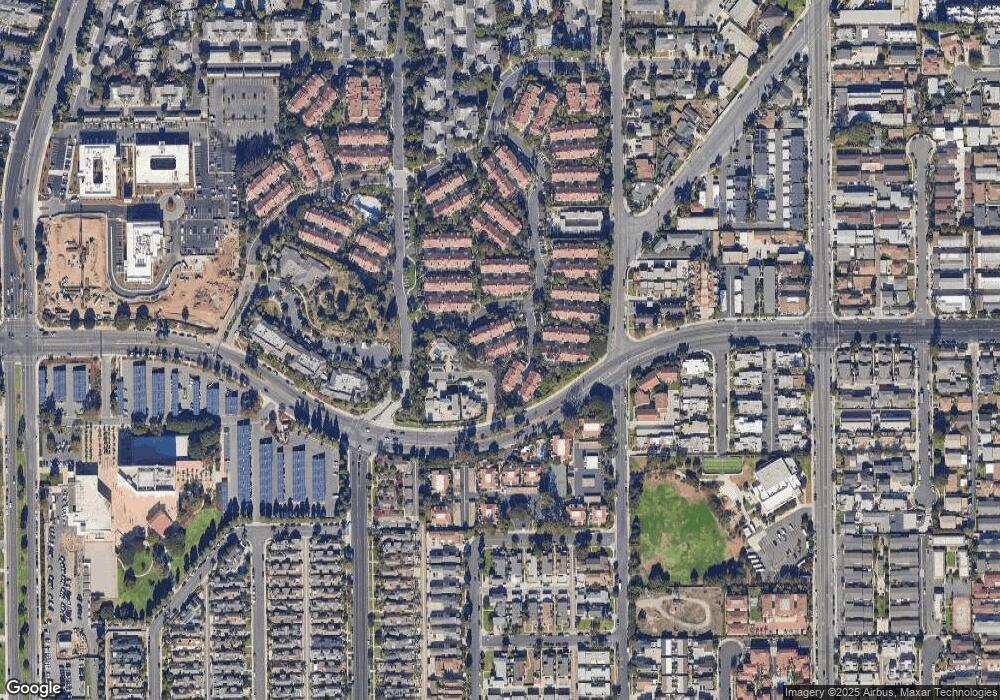
Map
Nearby Homes
- 19561 Pompano Ln Unit 106
- 19561 Pompano Ln Unit 104
- 19581 Pompano Ln Unit 107
- 19562 Pompano Ln Unit 108
- 215 Wichita Ave Unit 106
- 19412 Pompano Ln Unit 106
- 7412 Seabluff Dr Unit 108
- 2612 Del Way Unit B
- 1916 Pine St
- 409 Utica Ave Unit 1A
- 7402 Yellowtail Dr Unit 204
- 7351 Coho Dr Unit 207
- 1821 Lake St
- 1828 Pine St
- 19209 Tideline Ct
- 1824 Park St
- 19132 Shoreline Ln Unit 8
- 7270 Crystal Dr
- 19091 Azul Ln
- 7445 Seastar Dr Unit 6
- 19561 Pompano Ln
- 19561 Pompano Ln Unit 107
- 19561 Pompano Ln
- 19562 Pompano Ln
- 19561 Pompano Ln Unit 104
- 19561 Pompano Ln Unit 105
- 19561 Pompano Ln Unit 107
- 19561 Pompano Ln Unit 103
- 19561 Pompano Ln Unit 102
- 19561 Pompano Ln Unit 106
- 19561 Pompano Ln Unit 112
- 19561 Pompano Ln Unit 110
- 19561 Pompano Ln Unit 109
- 19561 Pompano Ln Unit 108
- 19561 Pompano Ln Unit 111
- 19581 Pompano Ln
- 19562 Pompano Ln Unit 106
- 19562 Pompano Ln Unit 111
- 19562 Pompano Ln Unit 105
- 19562 Pompano Ln Unit 104