19562 Butler Way Unit 11 Groveland, CA 95321
Estimated Value: $444,725 - $507,000
3
Beds
3
Baths
2,070
Sq Ft
$227/Sq Ft
Est. Value
About This Home
This home is located at 19562 Butler Way Unit 11, Groveland, CA 95321 and is currently estimated at $470,181, approximately $227 per square foot. 19562 Butler Way Unit 11 is a home located in Tuolumne County.
Ownership History
Date
Name
Owned For
Owner Type
Purchase Details
Closed on
Oct 28, 2021
Sold by
Jordan Thomas C and Jordan Debra J
Bought by
Pari Mukilan and Krishnamoorthy Bharathy
Current Estimated Value
Home Financials for this Owner
Home Financials are based on the most recent Mortgage that was taken out on this home.
Original Mortgage
$240,000
Outstanding Balance
$218,382
Interest Rate
2.5%
Mortgage Type
New Conventional
Estimated Equity
$251,799
Purchase Details
Closed on
Mar 29, 2013
Sold by
Jordan Thomas Craig and Jordan Debbie J
Bought by
Jordan Thomas C and Jordan Debraj
Purchase Details
Closed on
Jun 11, 2012
Sold by
Federal Home Loan Mortgage Corporation
Bought by
Jordan Thomas Craig and Jordan Debbie J
Purchase Details
Closed on
Apr 19, 2012
Sold by
Jpmorgan Chase Bank National Association
Bought by
Federal Home Loan Mortgage Corporation
Purchase Details
Closed on
Mar 1, 2012
Sold by
Lennen Richard W
Bought by
Jpmorgan Chase Bank Na
Purchase Details
Closed on
Apr 14, 2005
Sold by
Lalone Michael Anthony and Lalone Gwendolyn
Bought by
Lennen Richard W
Create a Home Valuation Report for This Property
The Home Valuation Report is an in-depth analysis detailing your home's value as well as a comparison with similar homes in the area
Home Values in the Area
Average Home Value in this Area
Purchase History
| Date | Buyer | Sale Price | Title Company |
|---|---|---|---|
| Pari Mukilan | $425,000 | First American Title Company | |
| Jordan Thomas C | -- | None Available | |
| Jordan Thomas Craig | $205,000 | Servicelink | |
| Federal Home Loan Mortgage Corporation | -- | Accommodation | |
| Jpmorgan Chase Bank Na | $168,714 | First American Title Company | |
| Lennen Richard W | $45,000 | Yosemite Title Co |
Source: Public Records
Mortgage History
| Date | Status | Borrower | Loan Amount |
|---|---|---|---|
| Open | Pari Mukilan | $240,000 |
Source: Public Records
Tax History Compared to Growth
Tax History
| Year | Tax Paid | Tax Assessment Tax Assessment Total Assessment is a certain percentage of the fair market value that is determined by local assessors to be the total taxable value of land and additions on the property. | Land | Improvement |
|---|---|---|---|---|
| 2025 | $4,939 | $451,013 | $53,060 | $397,953 |
| 2024 | $4,939 | $442,170 | $52,020 | $390,150 |
| 2023 | $4,832 | $433,500 | $51,000 | $382,500 |
| 2022 | $4,739 | $425,000 | $50,000 | $375,000 |
| 2021 | $2,645 | $237,874 | $17,403 | $220,471 |
| 2020 | $2,664 | $235,436 | $17,225 | $218,211 |
| 2019 | $2,584 | $230,821 | $16,888 | $213,933 |
| 2018 | $2,526 | $226,296 | $16,557 | $209,739 |
| 2017 | $2,475 | $221,860 | $16,233 | $205,627 |
| 2016 | $2,415 | $217,511 | $15,915 | $201,596 |
| 2015 | $2,384 | $214,244 | $15,676 | $198,568 |
| 2014 | $2,331 | $210,048 | $15,369 | $194,679 |
Source: Public Records
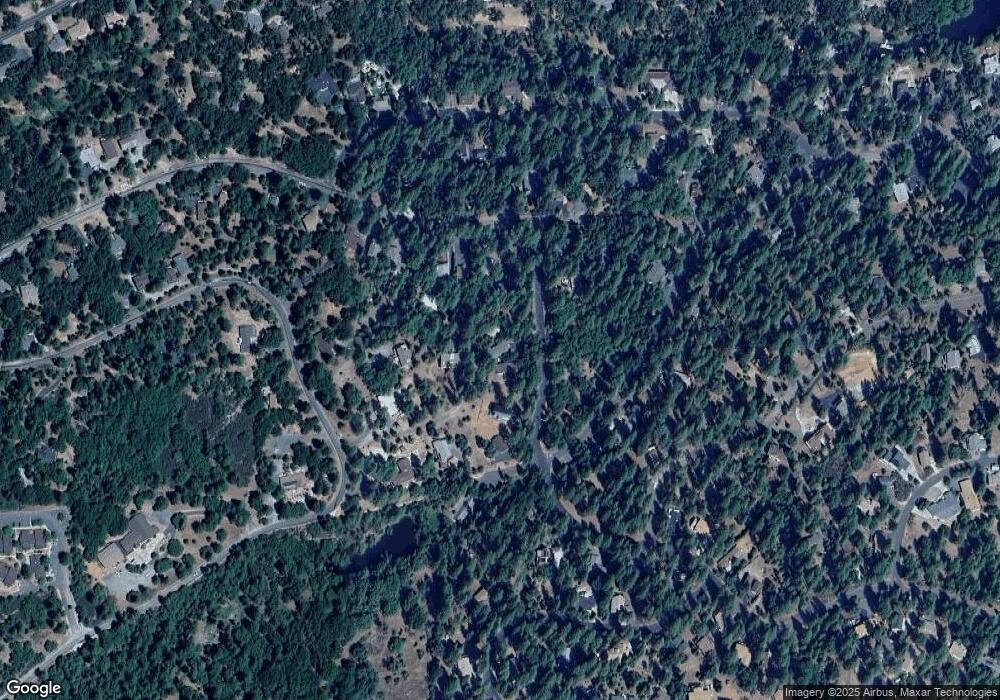
Map
Nearby Homes
- 19574 Butler Way
- 19555 Butler Way
- 19513 Grizzly Cir
- 19553 Elder Ln
- 12295 Sunnyside Way
- 19710 Butler Way
- 19501 Chaffee Cir
- 19440 Chaffee Cir
- 12064 Hillhurst Cir
- 19380 Pleasantview Dr
- 12017 Hillhurst Cir
- 19400 Reid Cir
- 19709 Pine Mountain Dr
- 19673 Jonny Degnan Ct
- 19220 Pleasantview Dr
- 11987 Valenta Way
- 19779 Pine Mountain Dr
- 19545 Pleasantview Dr
- 19562 Butler Way Unit 1-11
- 19562 Butler Way
- 19566 Butler Way Unit 10
- 19566 Butler Way
- 19635 Chamberlain Ct
- 19558 Butler Way
- 19554 Butler Way
- 19559 Butler Way
- 19532 Elder Ln
- 19561 Butler Way Unit 18
- 19574 Butler Way Unit 1 Lot 8
- 19557 Butler Way
- 19453 Pine Mountain Dr
- 19463 Pine Mountain Dr
- 19576 Butler Way
- 19473 Pine Mountain Dr
- 19492 Elder Ln
- 19493 Pine Mountain Dr
- 19443 Pine Mountain Dr Unit U1 L 30
- 19443 Pine Mountain Dr