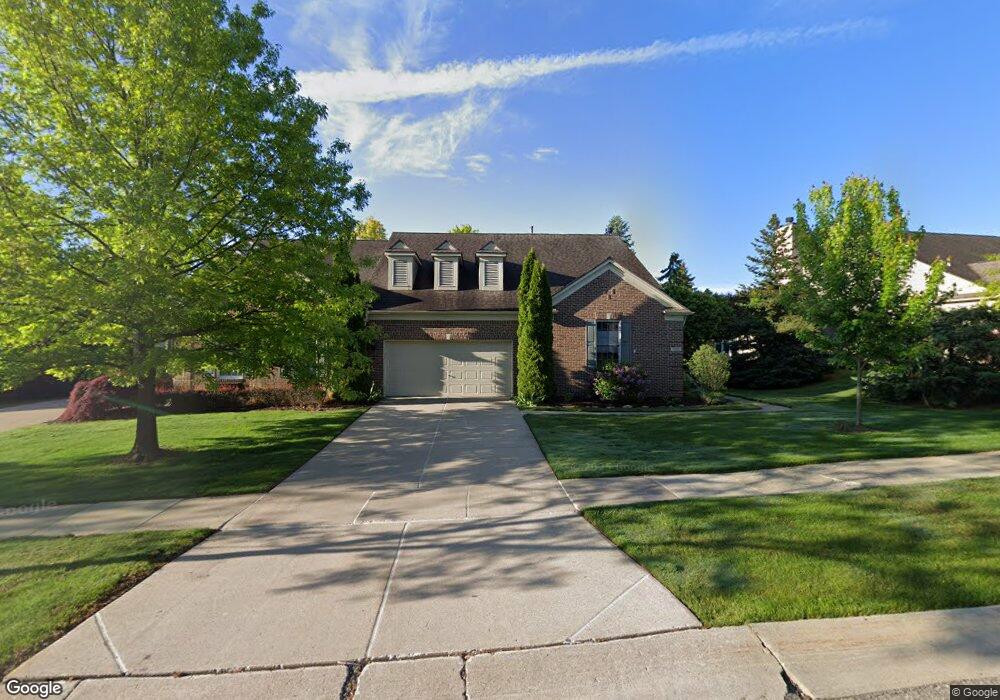
1958 Catlin Dr Unit 2 4 Rochester, MI 48306
Estimated Value: $488,000 - $519,000
4
Beds
3
Baths
1,916
Sq Ft
$265/Sq Ft
Est. Value
About This Home
This home is located at 1958 Catlin Dr Unit 2 4, Rochester, MI 48306 and is currently estimated at $506,866, approximately $264 per square foot. 1958 Catlin Dr Unit 2 4 is a home located in Oakland County with nearby schools including Hart Middle School, Hugger Elementary School, and Stoney Creek High School.
Ownership History
Date
Name
Owned For
Owner Type
Purchase Details
Closed on
Jul 2, 2025
Sold by
Cordaro Barbara Ann
Bought by
Barbara Ann Cordaro Trust and Cordaro
Current Estimated Value
Purchase Details
Closed on
Jul 30, 2019
Sold by
Mcgill Mayotte Leslie E
Bought by
Cordaro Barbara Ann
Purchase Details
Closed on
Sep 18, 2015
Sold by
Ball Kimberly A
Bought by
Dabaldo Evelyn L
Purchase Details
Closed on
Jul 6, 2011
Sold by
Klepinger Bette A
Bought by
Ball Kimberly A
Home Financials for this Owner
Home Financials are based on the most recent Mortgage that was taken out on this home.
Original Mortgage
$159,375
Interest Rate
4.52%
Mortgage Type
New Conventional
Purchase Details
Closed on
Jul 28, 2000
Sold by
Krull Frederick N
Bought by
Robert L Klepinger Tr
Purchase Details
Closed on
Aug 5, 1997
Sold by
Pulte Homes Mi
Bought by
Krull Frederick N
Create a Home Valuation Report for This Property
The Home Valuation Report is an in-depth analysis detailing your home's value as well as a comparison with similar homes in the area
Home Values in the Area
Average Home Value in this Area
Purchase History
| Date | Buyer | Sale Price | Title Company |
|---|---|---|---|
| Barbara Ann Cordaro Trust | -- | None Listed On Document | |
| Cordaro Barbara Ann | $368,000 | Etitle Agency Inc | |
| Dabaldo Evelyn L | $350,000 | Seaver Title Agency | |
| Ball Kimberly A | $212,500 | First American Title Ins Co | |
| Robert L Klepinger Tr | $286,000 | -- | |
| Krull Frederick N | $231,240 | -- |
Source: Public Records
Mortgage History
| Date | Status | Borrower | Loan Amount |
|---|---|---|---|
| Previous Owner | Ball Kimberly A | $159,375 |
Source: Public Records
Tax History Compared to Growth
Tax History
| Year | Tax Paid | Tax Assessment Tax Assessment Total Assessment is a certain percentage of the fair market value that is determined by local assessors to be the total taxable value of land and additions on the property. | Land | Improvement |
|---|---|---|---|---|
| 2024 | $5,868 | $211,080 | $0 | $0 |
| 2023 | $5,619 | $192,840 | $0 | $0 |
| 2022 | $5,977 | $183,980 | $0 | $0 |
| 2021 | $5,616 | $180,360 | $0 | $0 |
| 2020 | $5,273 | $173,930 | $0 | $0 |
| 2019 | $5,763 | $169,690 | $0 | $0 |
| 2018 | $5,897 | $171,230 | $0 | $0 |
| 2017 | $5,781 | $169,960 | $0 | $0 |
| 2016 | $5,598 | $164,820 | $0 | $0 |
| 2015 | -- | $146,610 | $0 | $0 |
| 2014 | -- | $128,280 | $0 | $0 |
| 2011 | -- | $107,340 | $0 | $0 |
Source: Public Records
Map
Nearby Homes
- 1955 Clearwood Ct Unit 665
- 1322 Copper Cir Unit 26
- 1983 Dunham Dr
- 2156 Willow Cir
- 2583 Barberry Dr
- 2113 Marissa Way Unit 99
- 54673 Marissa Way Unit 93
- 2423 Buckthorn Dr
- 1985 Monarch Dr Unit 7
- 2632 Hawthorne Dr S
- 2282 Kingscross Dr
- 628 Springview Dr Unit 120
- 54782 Whitby Way
- 54660 Whitby Way
- 6230 Winkler Mill Rd
- 674 Springview Dr
- 2239 Regency Hills Dr
- 1600 Mill Race
- 620 Appoline Ct
- 54438 Carrington Dr Unit Lot 110
- 1958 Catlin Dr
- 1958 Catlin Dr Unit 4
- 1970 Catlin Dr Unit 2
- 1946 Catlin Dr
- 1946 Catlin Dr Unit 6
- 1424 Copper Cir Unit 10
- 1436 Copper Cir Unit 8
- 1436 Copper Cir Unit 4, 8
- 1436 Copper Cir
- 1957 Catlin Dr
- 1945 Catlin Dr
- 1283 Miners Run
- 1406 Copper Cir Unit 12
- 1939 Catlin Dr
- 863 Garnet Ct
- 1222 Miners Run
- 1219 Miners Run
- 838 Garnet Ct
- 851 Garnet Ct
- 1936 Watson Cir