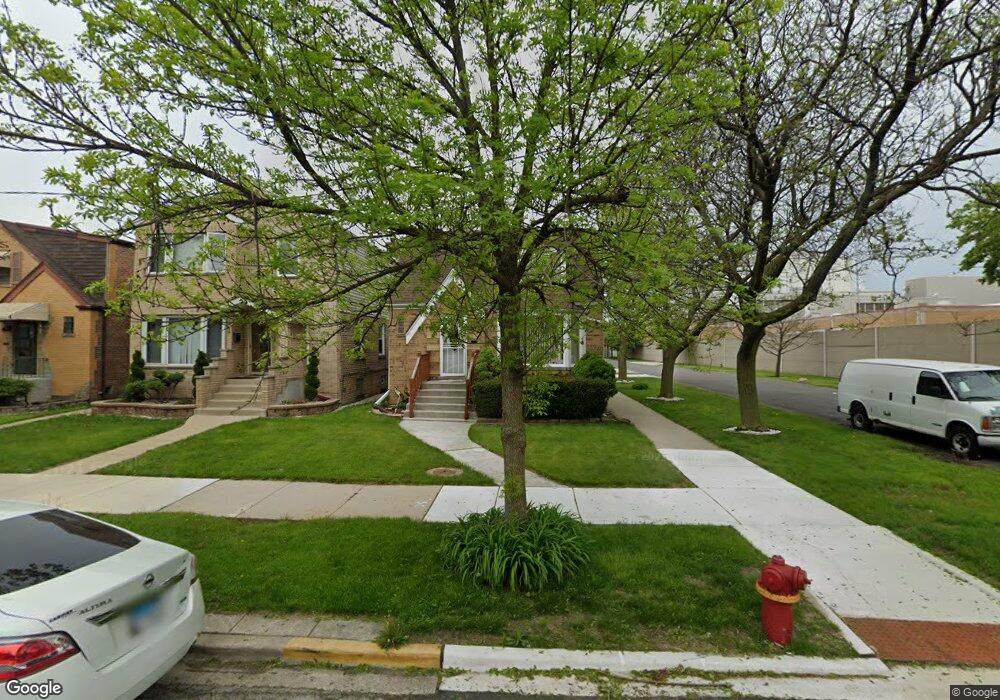
1958 N Natoma Ave Chicago, IL 60707
Galewood NeighborhoodEstimated Value: $310,000 - $387,000
4
Beds
3
Baths
1,400
Sq Ft
$252/Sq Ft
Est. Value
About This Home
This home is located at 1958 N Natoma Ave, Chicago, IL 60707 and is currently estimated at $352,725, approximately $251 per square foot. 1958 N Natoma Ave is a home located in Cook County with nearby schools including Sayre Elementary Language Academy, Steinmetz College Prep, and Acero - Roberto Clemente Elementary School.
Ownership History
Date
Name
Owned For
Owner Type
Purchase Details
Closed on
Oct 21, 2011
Sold by
Dibalsamo Carmine and Dibalsamo Eileen
Bought by
Brown Eddie P and Caldwell Brown Raeann M
Current Estimated Value
Home Financials for this Owner
Home Financials are based on the most recent Mortgage that was taken out on this home.
Original Mortgage
$236,839
Interest Rate
4.4%
Mortgage Type
FHA
Purchase Details
Closed on
Sep 21, 2009
Sold by
Lasalle Bank National Association
Bought by
Dibalsamo Carmine G and Dibalsamo Eileen J
Purchase Details
Closed on
Mar 27, 2009
Sold by
Tluczek
Bought by
Lasalle Bank National Association
Purchase Details
Closed on
Jun 26, 2006
Sold by
Jones Anthony and Jones Rosia L
Bought by
Tluczek Jacek
Home Financials for this Owner
Home Financials are based on the most recent Mortgage that was taken out on this home.
Original Mortgage
$232,000
Interest Rate
9.37%
Mortgage Type
Unknown
Create a Home Valuation Report for This Property
The Home Valuation Report is an in-depth analysis detailing your home's value as well as a comparison with similar homes in the area
Home Values in the Area
Average Home Value in this Area
Purchase History
| Date | Buyer | Sale Price | Title Company |
|---|---|---|---|
| Brown Eddie P | $243,000 | First American Title Ins Co | |
| Dibalsamo Carmine G | $90,000 | Premier Title | |
| Lasalle Bank National Association | -- | None Available | |
| Tluczek Jacek | $290,000 | Ats |
Source: Public Records
Mortgage History
| Date | Status | Borrower | Loan Amount |
|---|---|---|---|
| Previous Owner | Brown Eddie P | $236,839 | |
| Previous Owner | Tluczek Jacek | $232,000 |
Source: Public Records
Tax History Compared to Growth
Tax History
| Year | Tax Paid | Tax Assessment Tax Assessment Total Assessment is a certain percentage of the fair market value that is determined by local assessors to be the total taxable value of land and additions on the property. | Land | Improvement |
|---|---|---|---|---|
| 2024 | $5,000 | $26,000 | $10,893 | $15,107 |
| 2023 | $4,853 | $27,000 | $8,785 | $18,215 |
| 2022 | $4,853 | $27,000 | $8,785 | $18,215 |
| 2021 | $4,763 | $27,000 | $8,785 | $18,215 |
| 2020 | $3,677 | $19,598 | $4,392 | $15,206 |
| 2019 | $3,737 | $22,021 | $4,392 | $17,629 |
| 2018 | $3,673 | $22,021 | $4,392 | $17,629 |
| 2017 | $3,760 | $20,831 | $3,865 | $16,966 |
| 2016 | $3,674 | $20,831 | $3,865 | $16,966 |
| 2015 | $3,338 | $20,831 | $3,865 | $16,966 |
| 2014 | $3,271 | $20,186 | $3,514 | $16,672 |
| 2013 | $3,195 | $20,186 | $3,514 | $16,672 |
Source: Public Records
Map
Nearby Homes
- 1937 N Normandy Ave
- 1733 N Oak Park Ave
- 1700 N Natoma Ave
- 1639 N Normandy Ave
- 1701 N Newland Ave
- 2324 N Oak Park Ave
- 1905 N Nordica Ave
- 2218 N Newland Ave Unit 203
- 2311 N Natchez Ave
- 1227 N East Ave
- 1600 N New England Ave Unit 4
- 1627 N Narragansett Ave
- 2054 N Nordica Ave
- 2430 N Normandy Ave
- 1221 Edmer Ave
- 2320 N Mulligan Ave
- 2224 N Nordica Ave
- 1130 N Grove Ave
- 2037 N Harlem Ave Unit 3E
- 2045 N Harlem Ave Unit 1E
- 1954 N Natoma Ave
- 1952 N Natoma Ave
- 1948 N Natoma Ave
- 1946 N Natoma Ave
- 1959 N Normandy Ave
- 1955 N Normandy Ave
- 1942 N Natoma Ave
- 1953 N Normandy Ave
- 1949 N Normandy Ave
- 1940 N Natoma Ave
- 1947 N Normandy Ave
- 1959 N Natoma Ave
- 1955 N Natoma Ave
- 1953 N Natoma Ave
- 1949 N Natoma Ave
- 1936 N Natoma Ave
- 1947 N Natoma Ave
- 1941 N Normandy Ave
- 2158 N Nashville Ave Unit 3
- 2140 N Nashville Ave Unit 3