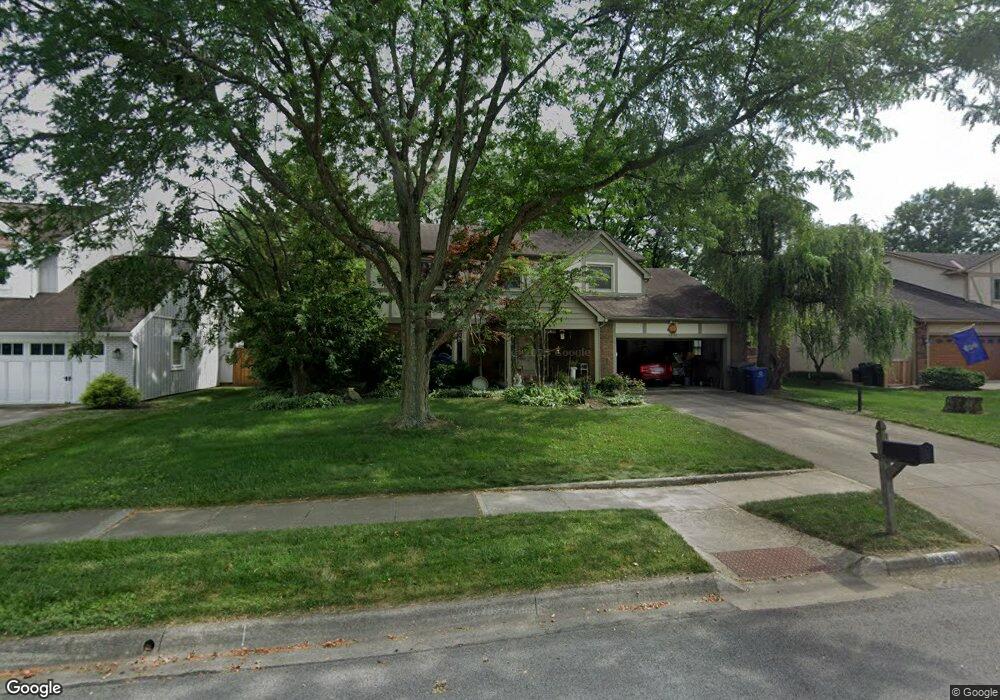
1959 Fraley Dr Columbus, OH 43235
The Gables NeighborhoodEstimated Value: $425,800 - $496,000
4
Beds
3
Baths
2,074
Sq Ft
$218/Sq Ft
Est. Value
About This Home
This home is located at 1959 Fraley Dr, Columbus, OH 43235 and is currently estimated at $452,950, approximately $218 per square foot. 1959 Fraley Dr is a home located in Franklin County with nearby schools including Daniel Wright Elementary School, Ann Simpson Davis Middle School, and Dublin Scioto High School.
Ownership History
Date
Name
Owned For
Owner Type
Purchase Details
Closed on
Oct 4, 2013
Sold by
Borgia Lynnee M
Bought by
Borgia Vittorio A
Current Estimated Value
Purchase Details
Closed on
May 9, 2005
Sold by
Kington Elaine
Bought by
Borgia Vittorio A and Borgia Lynnee M
Home Financials for this Owner
Home Financials are based on the most recent Mortgage that was taken out on this home.
Original Mortgage
$174,500
Interest Rate
6.05%
Mortgage Type
Fannie Mae Freddie Mac
Purchase Details
Closed on
Jul 24, 1987
Bought by
Kington Elaine
Purchase Details
Closed on
Sep 1, 1983
Create a Home Valuation Report for This Property
The Home Valuation Report is an in-depth analysis detailing your home's value as well as a comparison with similar homes in the area
Home Values in the Area
Average Home Value in this Area
Purchase History
| Date | Buyer | Sale Price | Title Company |
|---|---|---|---|
| Borgia Vittorio A | $33,000 | None Available | |
| Borgia Vittorio A | $224,500 | Williamson | |
| Kington Elaine | -- | -- | |
| -- | $110,000 | -- |
Source: Public Records
Mortgage History
| Date | Status | Borrower | Loan Amount |
|---|---|---|---|
| Previous Owner | Borgia Vittorio A | $174,500 |
Source: Public Records
Tax History Compared to Growth
Tax History
| Year | Tax Paid | Tax Assessment Tax Assessment Total Assessment is a certain percentage of the fair market value that is determined by local assessors to be the total taxable value of land and additions on the property. | Land | Improvement |
|---|---|---|---|---|
| 2024 | $7,238 | $119,670 | $38,640 | $81,030 |
| 2023 | $7,136 | $119,665 | $38,640 | $81,025 |
| 2022 | $5,770 | $89,920 | $27,300 | $62,620 |
| 2021 | $5,863 | $89,920 | $27,300 | $62,620 |
| 2020 | $5,828 | $89,920 | $27,300 | $62,620 |
| 2019 | $5,266 | $71,930 | $21,840 | $50,090 |
| 2018 | $5,358 | $71,930 | $21,840 | $50,090 |
| 2017 | $5,129 | $71,930 | $21,840 | $50,090 |
| 2016 | $5,395 | $74,980 | $17,610 | $57,370 |
| 2015 | $5,429 | $74,980 | $17,610 | $57,370 |
| 2014 | $5,434 | $74,980 | $17,610 | $57,370 |
| 2013 | $2,627 | $71,400 | $16,765 | $54,635 |
Source: Public Records
Map
Nearby Homes
- 5624 Wigmore Dr Unit 50B
- 2229 Teardrop Ave Unit 35E
- 2260 Lila Way Unit 62D
- 2265 Teardrop Ave Unit 39C
- 2179 Victoria Park Dr Unit 2179
- 2236 Victoria Park Dr Unit 2236
- 2172 Hedgerow Rd Unit 2172G
- 5268 Captains Ct
- 1540 Slade Ave Unit 303
- 5283 Ruthton Rd Unit 19
- 5111 Schuylkill St
- 2527 Maxim Ln Unit 40D
- 5363 Godown Rd
- 5111 Portland St
- 2522 Gardenia Dr Unit 16C
- 1739 Paula Dr Unit 1739
- 2560 Trotterslane Dr
- 5294 Brandy Oaks Ln
- 5273 Brandy Oaks Ln
- 5646 Dorsey Dr
- 1945 Fraley Dr
- 1967 Fraley Dr
- 5584 Whimpstone Ct
- 5576 Whimpstone Ct
- 1975 Fraley Dr
- 5628 Fraley Ct
- 1917 Fraley Dr
- 5567 Ramblewood Ct
- 5581 Whimpstone Ct
- 5629 Fraley Ct
- 5559 Ramblewood Ct
- 1987 Fraley Dr
- 5599 Ramblewood Ct
- 5640 Fraley Ct
- 1920 Ramblewood Ave
- 5568 Whimpstone Ct
- 5641 Fraley Ct
- 1910 Ramblewood Ave
- 5573 Whimpstone Ct
- 5600 Tangarey Ct