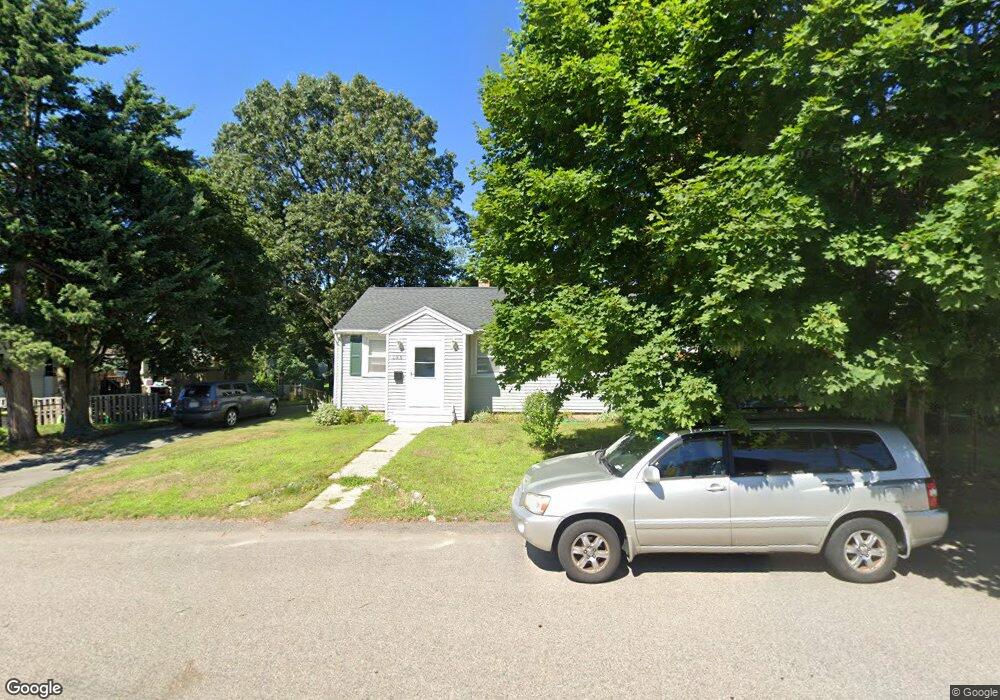
196 Drew Ave Brockton, MA 02302
Estimated Value: $397,000 - $480,000
3
Beds
1
Bath
748
Sq Ft
$565/Sq Ft
Est. Value
About This Home
This home is located at 196 Drew Ave, Brockton, MA 02302 and is currently estimated at $422,316, approximately $564 per square foot. 196 Drew Ave is a home located in Plymouth County with nearby schools including Brookfield Elementary School, Mary E. Baker Elementary School, and Downey Elementary School.
Ownership History
Date
Name
Owned For
Owner Type
Purchase Details
Closed on
Sep 8, 2020
Sold by
Nadeau Barbara A and Nadeau Thomas P
Bought by
Nadeau Barbara A and Barbara-Jacques Leanne
Current Estimated Value
Purchase Details
Closed on
Mar 16, 1993
Sold by
Nerrifield David L and Merrifield Kelly
Bought by
Nadeau Barbara A and Nadeau Thomas P
Home Financials for this Owner
Home Financials are based on the most recent Mortgage that was taken out on this home.
Original Mortgage
$68,238
Interest Rate
7.8%
Mortgage Type
Purchase Money Mortgage
Purchase Details
Closed on
Feb 26, 1988
Sold by
Bonanni James A
Bought by
Merrifield David L
Home Financials for this Owner
Home Financials are based on the most recent Mortgage that was taken out on this home.
Original Mortgage
$102,600
Interest Rate
10.49%
Mortgage Type
Purchase Money Mortgage
Create a Home Valuation Report for This Property
The Home Valuation Report is an in-depth analysis detailing your home's value as well as a comparison with similar homes in the area
Purchase History
| Date | Buyer | Sale Price | Title Company |
|---|---|---|---|
| Nadeau Barbara A | -- | None Available | |
| Nadeau Barbara A | $69,900 | -- | |
| Merrifield David L | $114,000 | -- |
Source: Public Records
Mortgage History
| Date | Status | Borrower | Loan Amount |
|---|---|---|---|
| Previous Owner | Merrifield David L | $100,000 | |
| Previous Owner | Merrifield David L | $68,238 | |
| Previous Owner | Merrifield David L | $102,600 |
Source: Public Records
Tax History
| Year | Tax Paid | Tax Assessment Tax Assessment Total Assessment is a certain percentage of the fair market value that is determined by local assessors to be the total taxable value of land and additions on the property. | Land | Improvement |
|---|---|---|---|---|
| 2025 | $4,519 | $373,200 | $144,000 | $229,200 |
| 2024 | $4,467 | $371,600 | $144,000 | $227,600 |
| 2023 | $4,426 | $341,000 | $108,700 | $232,300 |
| 2022 | $3,853 | $275,800 | $98,700 | $177,100 |
| 2021 | $3,637 | $250,800 | $91,200 | $159,600 |
| 2020 | $3,630 | $239,600 | $87,600 | $152,000 |
| 2019 | $3,386 | $217,900 | $81,000 | $136,900 |
| 2018 | $3,262 | $203,100 | $81,000 | $122,100 |
| 2017 | $2,855 | $177,300 | $81,000 | $96,300 |
| 2016 | $2,314 | $133,300 | $77,200 | $56,100 |
| 2015 | $2,174 | $119,800 | $77,200 | $42,600 |
| 2014 | $2,357 | $130,000 | $77,200 | $52,800 |
Source: Public Records
Map
Nearby Homes
Your Personal Tour Guide
Ask me questions while you tour the home.