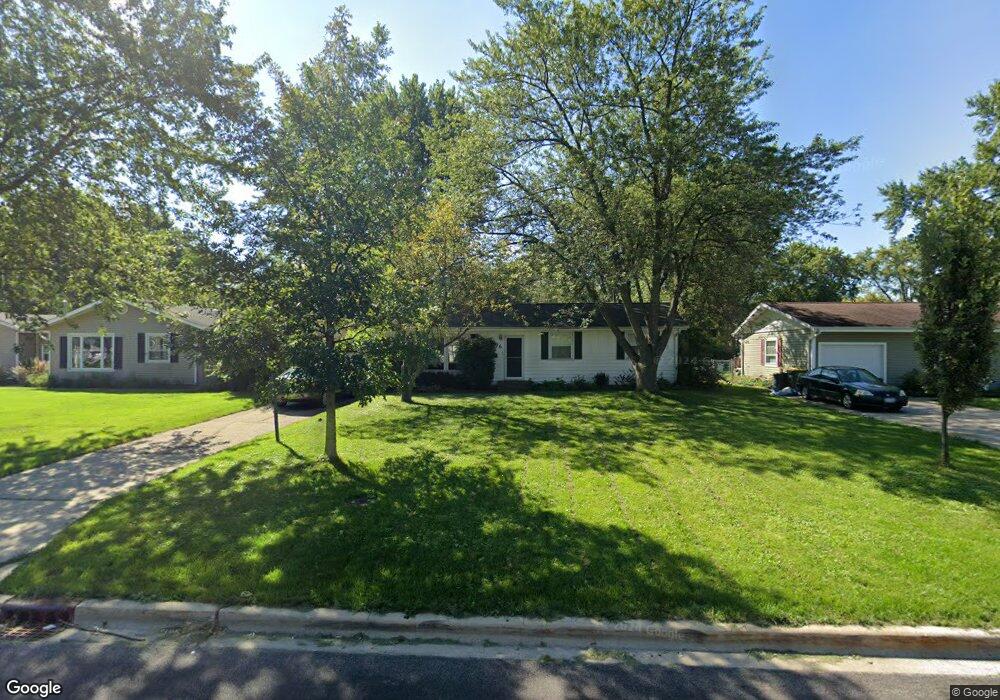
196 Mohawk Dr Unit 2 Carol Stream, IL 60188
Estimated Value: $323,000 - $342,000
3
Beds
2
Baths
1,056
Sq Ft
$315/Sq Ft
Est. Value
About This Home
This home is located at 196 Mohawk Dr Unit 2, Carol Stream, IL 60188 and is currently estimated at $332,699, approximately $315 per square foot. 196 Mohawk Dr Unit 2 is a home located in DuPage County with nearby schools including Carol Stream Elementary School, Jay Stream Middle School, and Glenbard North High School.
Ownership History
Date
Name
Owned For
Owner Type
Purchase Details
Closed on
Nov 10, 2025
Sold by
Larson Jacob K and Larson Caitlin M
Bought by
Larson Jacob K and Larson Caitlin M
Current Estimated Value
Home Financials for this Owner
Home Financials are based on the most recent Mortgage that was taken out on this home.
Original Mortgage
$460,000
Outstanding Balance
$458,587
Interest Rate
5.88%
Mortgage Type
Construction
Estimated Equity
-$125,888
Purchase Details
Closed on
Apr 20, 2011
Sold by
Chilton Thomas and Chilton Heather
Bought by
Larson Jacob K and Murphy Caitlin M
Home Financials for this Owner
Home Financials are based on the most recent Mortgage that was taken out on this home.
Original Mortgage
$151,500
Interest Rate
5.5%
Mortgage Type
FHA
Purchase Details
Closed on
Jan 30, 2001
Sold by
Chilton Heather
Bought by
Chilton Thomas and Chilton Heather
Home Financials for this Owner
Home Financials are based on the most recent Mortgage that was taken out on this home.
Original Mortgage
$131,900
Interest Rate
7.06%
Purchase Details
Closed on
Jun 28, 2000
Sold by
Butler Steven P and Butler Allison B
Bought by
Chilton Heather
Home Financials for this Owner
Home Financials are based on the most recent Mortgage that was taken out on this home.
Original Mortgage
$130,950
Interest Rate
8.66%
Create a Home Valuation Report for This Property
The Home Valuation Report is an in-depth analysis detailing your home's value as well as a comparison with similar homes in the area
Home Values in the Area
Average Home Value in this Area
Purchase History
| Date | Buyer | Sale Price | Title Company |
|---|---|---|---|
| Larson Jacob K | -- | None Listed On Document | |
| Larson Jacob K | $155,500 | None Available | |
| Chilton Thomas | -- | -- | |
| Chilton Heather | $145,500 | Chicago Title Insurance Co |
Source: Public Records
Mortgage History
| Date | Status | Borrower | Loan Amount |
|---|---|---|---|
| Open | Larson Jacob K | $460,000 | |
| Previous Owner | Larson Jacob K | $151,500 | |
| Previous Owner | Chilton Thomas | $131,900 | |
| Previous Owner | Chilton Heather | $130,950 |
Source: Public Records
Tax History
| Year | Tax Paid | Tax Assessment Tax Assessment Total Assessment is a certain percentage of the fair market value that is determined by local assessors to be the total taxable value of land and additions on the property. | Land | Improvement |
|---|---|---|---|---|
| 2024 | $6,484 | $83,577 | $31,023 | $52,554 |
| 2023 | $6,114 | $76,430 | $28,370 | $48,060 |
| 2022 | $6,004 | $71,080 | $28,190 | $42,890 |
| 2021 | $5,716 | $67,530 | $26,780 | $40,750 |
| 2020 | $5,618 | $65,890 | $26,130 | $39,760 |
| 2019 | $5,397 | $63,320 | $25,110 | $38,210 |
| 2018 | $4,975 | $59,550 | $24,450 | $35,100 |
| 2017 | $4,688 | $55,190 | $22,660 | $32,530 |
| 2016 | $4,423 | $51,080 | $20,970 | $30,110 |
| 2015 | $4,306 | $47,670 | $19,570 | $28,100 |
| 2014 | $4,369 | $47,510 | $20,230 | $27,280 |
| 2013 | $4,401 | $49,130 | $20,920 | $28,210 |
Source: Public Records
Map
Nearby Homes
- 213 Arapahoe Trail
- 1N053 Lot 1 Farwell St
- 1N063 LOT 2 Farwell St
- 1N083 LOT 4 Farwell St
- 1043 Quarry Ct Unit 11
- 1421 Preserve Dr Unit 18
- 1N073 LOT 3 Farwell St
- 1N082 LOT 6 Morse St
- 1027 Quarry Ct Unit 7
- 155 Surrey Dr
- 1N 327 Gary Ave
- 350 Shawnee Dr
- 565 Edgebrook Ct
- 403 Arrowhead Trail
- 768 N Gary Ave Unit 103
- 1426 Preserve Dr Unit 30
- 1035 Quarry Ct Unit 9
- 720 Hoover Dr Unit 124
- 788 N Gary Ave Unit 103
- 27W130 W Street Charles Rd
- 190 Mohawk Dr
- 206 Mohawk Dr
- 214 Tomahawk Ct
- 180 Mohawk Dr
- 199 Thunderbird Trail
- 183 Thunderbird Trail
- 197 Mohawk Dr
- 218 Tomahawk Ct
- 207 Mohawk Dr
- 191 Mohawk Dr
- 176 Mohawk Dr
- 401 Tomahawk Ct
- 203 Thunderbird Trail
- 179 Thunderbird Trail Unit 2
- 181 Mohawk Dr
- 217 Yuma Ln
- 170 Mohawk Dr
- 170 Mohawk Dr
- 177 Mohawk Dr
- 225 Tomahawk Ct
Your Personal Tour Guide
Ask me questions while you tour the home.